
Read the bar graph shown in Fig. and answer the following questions:
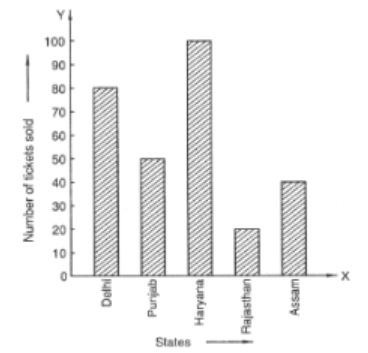
Of which state were the minimum number of tickets sold?
Important Questions on Data Handling-III (Bar Graphs)
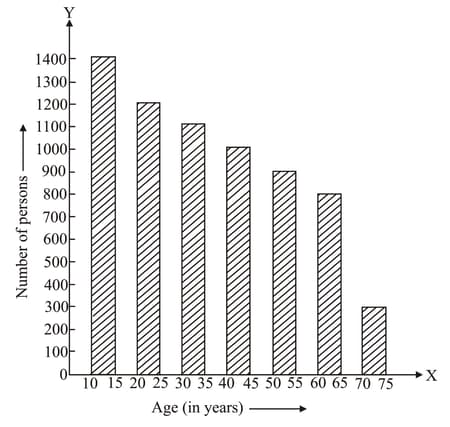
Study the bar graph representing the number of persons in various age groups in a town shown in Fig. Observe the bar graph and answer the following questions:
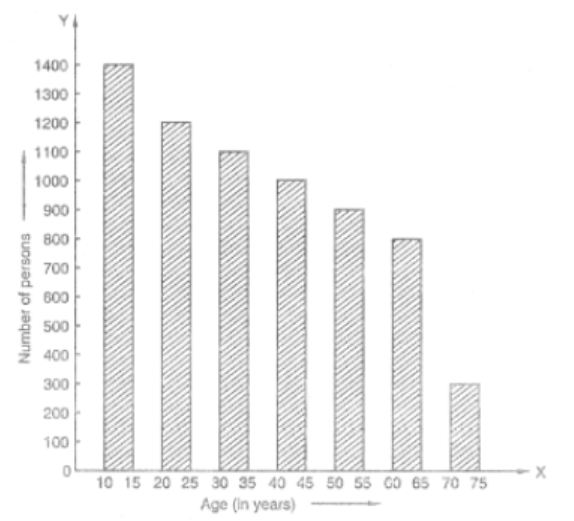
What is the percentage of the youngest age-group persons over those in the oldest age group?
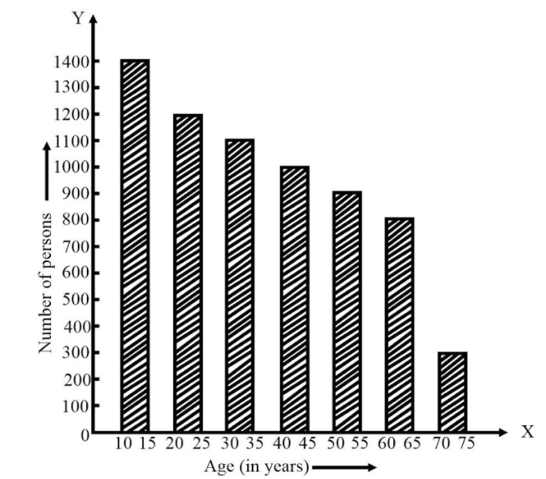
Study the bar graph representing the number of persons in various age groups in a town shown in Fig. Observe the bar graph and answer the following questions:
What is the total population of the town?
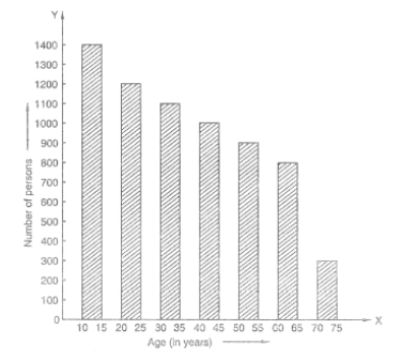
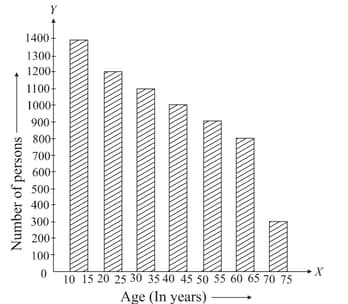
Study the bar graph below representing the number of persons in various age groups in a town. 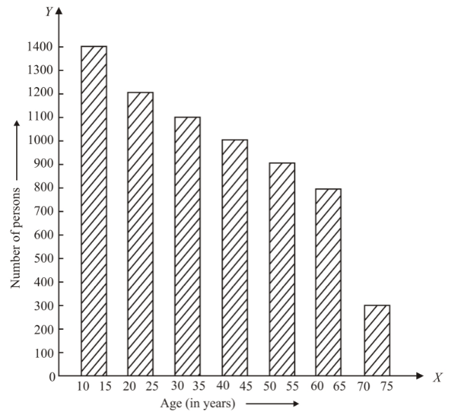
What is the number of persons in the age group ?
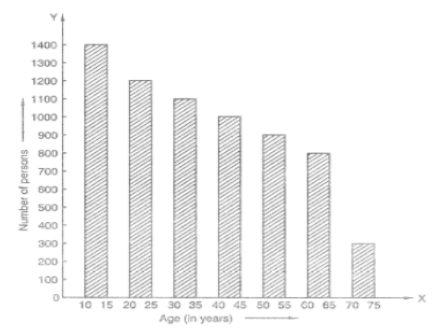
The following bar graph represents the number of persons in various age groups in a town.
How many persons are more in the age-group than in the age group ?
Study the bar graph representing the number of persons in various age groups in a town shown in figure. Observe the bar graph and answer the question:
What is the age-group of exactly persons living in the town?
Study the bar graph representing the number of persons in various age groups in a town shown in figure.
What is the total number of persons living in the town in the age-group ?
Study the bar graph representing the number of persons in various age groups in a town shown in Fig. Observe the bar graph and answer the following questions:

What is the total number of persons living in the town in the age-groups and ?
Study the bar graph representing the number of persons in various age groups in a town shown in Fig. Observe the bar graph and answer the following questions:
Whether the population in general increases, decreases or remains constant with the increase in the age-group.


