
Read the bar graph shown in Figure and answer the following questions:
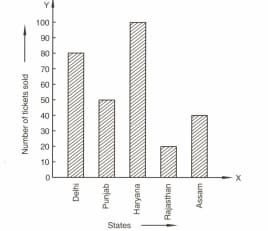
What is the information given by the bar graph?
Important Questions on Graphical Representation of Statistical Data
Read the bar graph shown in Figure and answer the following questions:
How many tickets of Assam State Lottery were sold by the agent?
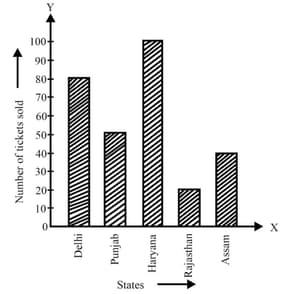
Read the bar graph shown in Figure and answer the following questions:
Of which state, where the maximum number of tickets sold?
Read the bar graph shown in Figure and answer the following questions:

State whether true or false.
The maximum number of tickets sold is three times the minimum number of tickets sold.
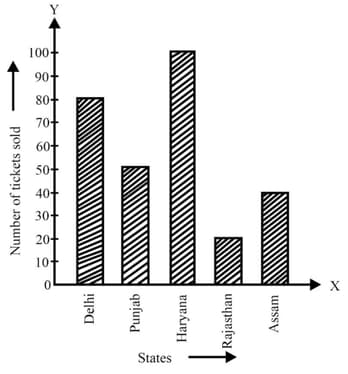
Read the bar graph shown in the figure and answer the following questions:

Of which state were the minimum number of tickets sold?
Study the bar graph representing the number of persons in various age groups in a town shown in the figure, Observe the bar graph, and answer the following questions:

What is the percentage of the youngest age-group persons over those in the oldest age group?
Study the bar graph representing the number of persons in various age groups in a town shown in figure. Observe the bar graph and answer the following questions:
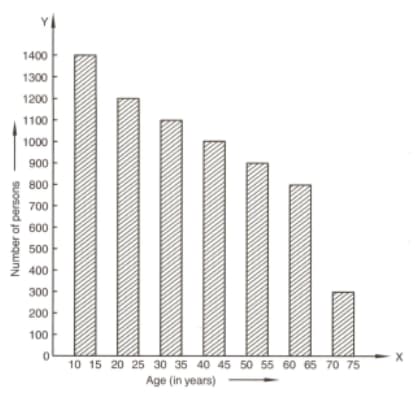
What is the total population of the town?
Study the bar graph representing the number of persons in various age groups in a town shown in the figure. Observe the bar graph and answer the following questions:

What is the number of persons in the age group ?
Study the bar graph representing the number of persons in various age groups in a town shown in the figure. Observe the bar graph and answer the following questions:

How many persons are more in the age-group than in the age group?


