
Read the following bar graph and answer the following question:

What information is given by the bar graph?
Important Questions on Data Handling-III (Bar Graphs)
Read the following bar graph and answer the following question:
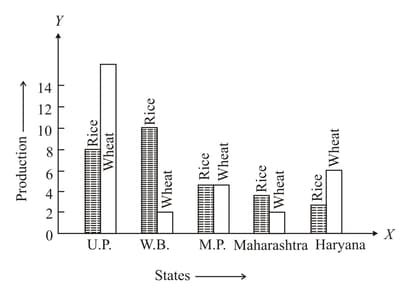
Which state is the largest producer of rice?
Read the following bar graph and answer the following question:

Which state is the largest producer of wheat?
Read the following bar graph and answer the following question:
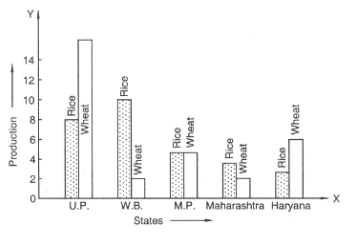
Which state has total production of rice and wheat as its maximum?
Read the following bar graph and answer the following question:

Which state has the total production of wheat and rice minimum?
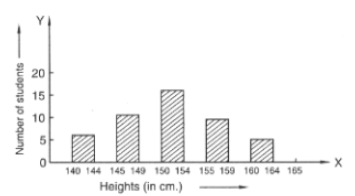
The following bar graph represents the heights in of students of Class of a particular school.
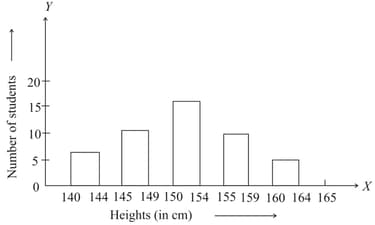
If the percentage of the total number of students having their heights more than is , then find the value of .
The following bar graph represents the heights (in ) of students of Class of a particular school. Study the graph and answer the following question:
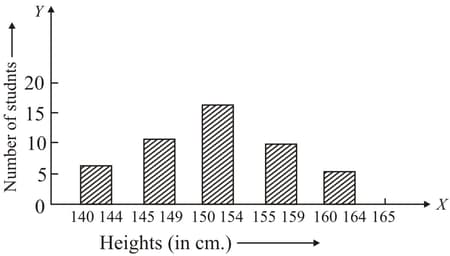
How many students in the class are in the range of maximum height of the class?
The following bar graph represents the heights (in ) of students of Class of a particular school. Study the graph and answer the following question:
The school wants to provide a particular type of tonic to each student below the height of to improve his height. If the cost of the tonic for each student comes out to be , how much amount of money is required? (Write the answer without rupees symbol)
The following bar graph represents the heights (in ) of students of Class of a particular school. Study the graph and answer the following question:
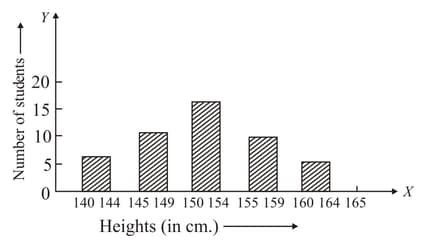
How many students are in the range of the shortest height in the class? ()


