
Read the following bar graph.
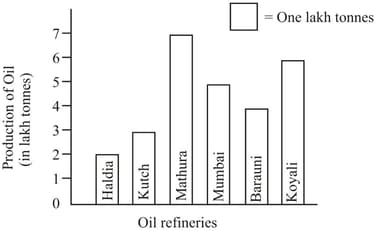
Which oil refinery produces maximum oil?
Which oil refinery produces maximum oil?
Important Questions on Data Handling
Read the following bar graph.

Now answer the following question:
Name oil refineries which produce oil less than lakh tonnes.
Read the following bar graph.
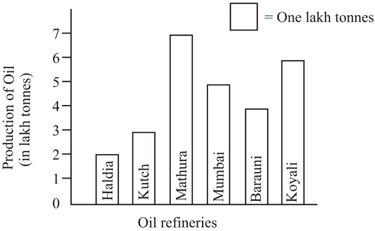
Now answer the following question:
How much oil is produced by Mumbai oil refinery?
The bar graph given alongside shows the amount of wheat purchased by government during the year
Read the bar graph and write down your observations. In which year the wheat production was maximum.
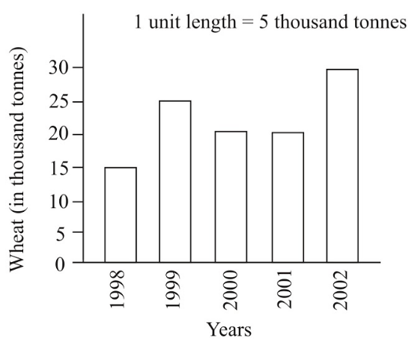
Read the bar graph and write down your observations. In which year the wheat production was minimum.

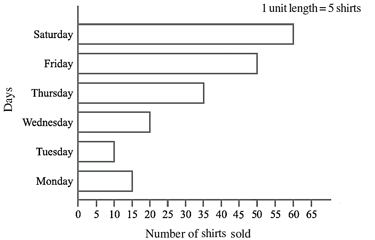
Observe this bar graph which is showing the sale of shirts in a readymade shop from Monday to Saturday.
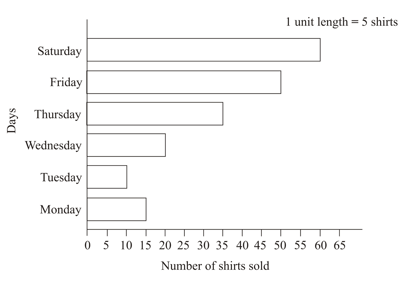
What information does the above bar graph give.
Observe this bar graph which is showing the sale of shirts in a readymade shop from Monday to Saturday.

Now answer the following question:
Mention the scale chosen on the horizontal line representing number of shirts.
Observe this bar graph which is showing the sale of shirts in a readymade shop from Monday to Saturday.

Now answer the following question:
Mention the day on which maximum number of shirts were sold and also mention the number of shirts sold.
Observe this bar graph which is showing the sale of shirts in a readymade shop from Monday to Saturday.
Now answer the following question:
Mention the day on which minimum number of shirts were sold.


