
Read the following graph carefully and answer the question given below.
The bar graph shows the total attendance of the audience in the stadium in five different matches of CSK. The line graph shows the percentage of the foreign audience out of total attendance.
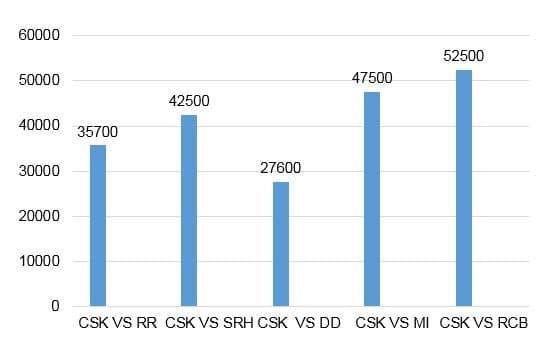
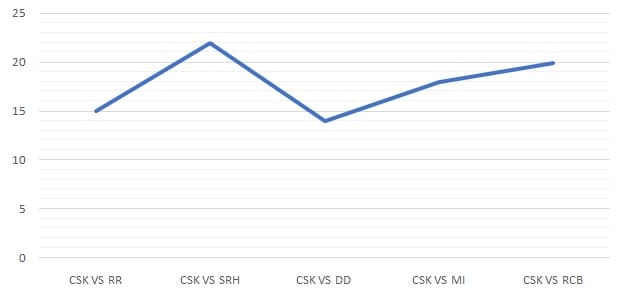
Note → total attendance = Indian + Foreign
Calculate the total Indian audience in CSK VS SRH and CSK VS MI together, whether it is more or less than the Indian audience in CSK VS RR and CSK VS RCB together?
Important Questions on Graphical Representation of Data
The given bar graph shows the imports and exports (in ) of steel by a country from to .
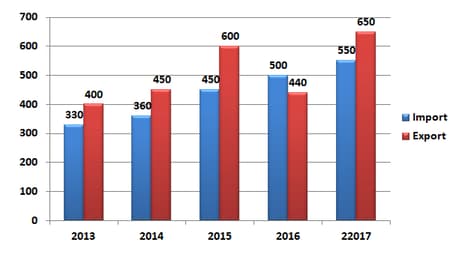
In how many years were the imports more than of the average exports (per year) of the country during the given years?
The given bar chart shows the details of cycle sales by a company between January and May for years and .
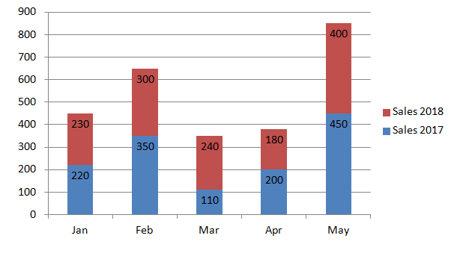
In the given bar chart, which month sales show the maximum decrease in as compared to?
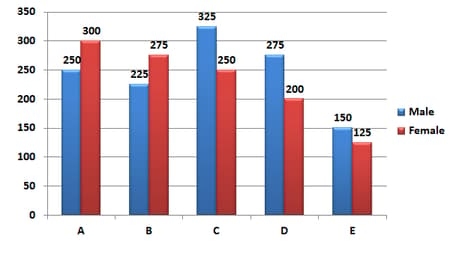
In the given bar graph, what is the average number of females in all five organisations?
The given pie-chart depicts the expenditure incurred in towards each sport.
Expenses (in )

In the given pie-chart, what is the ratio of expenditure between hockey and gymnastics?
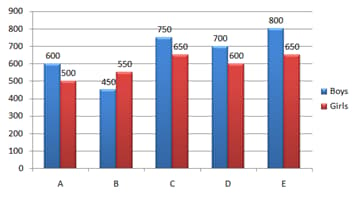
The given bar graph represents the number of boys and girls in five different schools. Read the graph and answer the question that follows.

What is the ratio of the girls from schools A, B and C taken together to the boys from all the schools taken together?
The given pie-chart depicts the expenditure incurred in towards each sport.
Expenses (in )
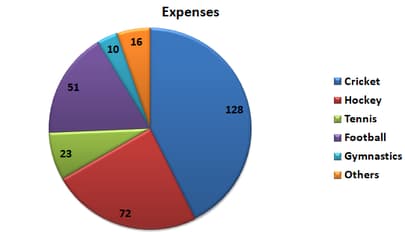
In the given pie-chart, what will be the central angle of the sector representing football?
In the given bar graph, what is the ratio of the total males and females working in all organisations?
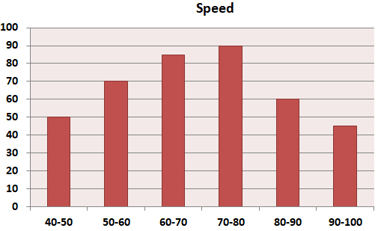
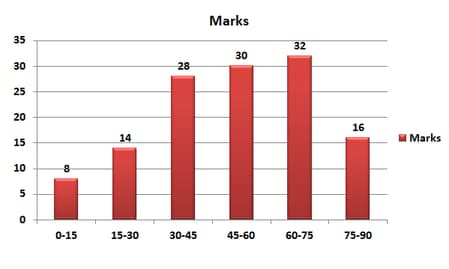
In the given histogram, in which class interval, the median lies?
The given bar chart shows the production of steel by companies A, B, C, and D for years (in tonnes).
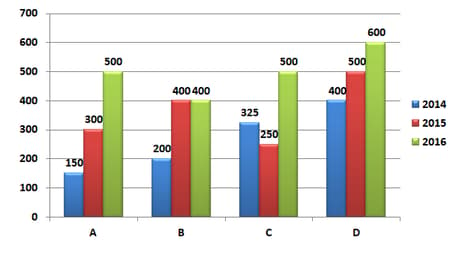
In the given bar chart, what is the percentage production of ‘B‘ in to the total production of ?
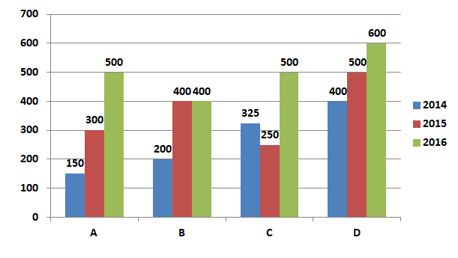 The given bar chart shows the production of steel by companies A, B, C, and D for years (in tonnes).
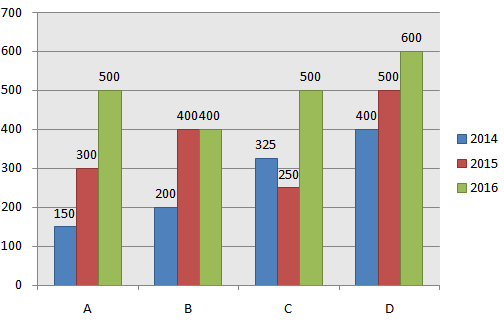
In the given bar-chart, which company has the maximum total production of steel?
The given pie-chart depicts the expenditure incurred in towards each sport.
Expenses (in )
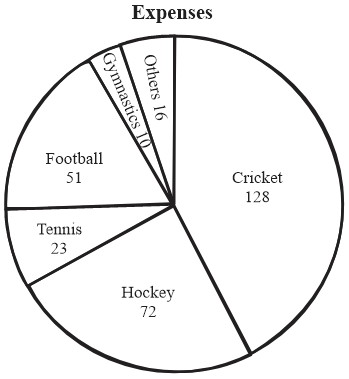
In the given pie-chart, what is the difference between the expenditure incurred on cricket and football?
The number of students in Class in Science, Arts and Commerce streams of a school over a period of years () has been depicted through the bar chart given below:
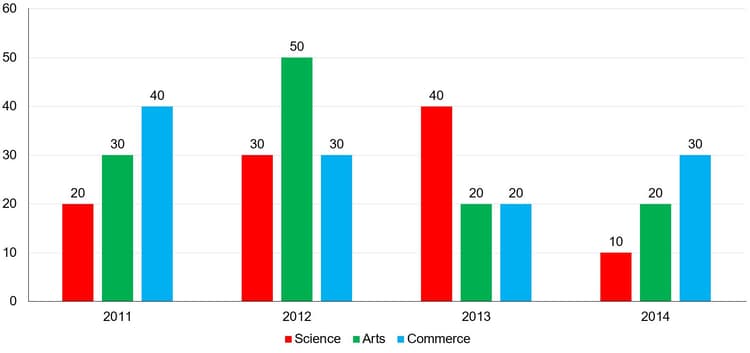
What is the average of the number of Arts students in the given class over the given period of years?
In the given bar graph, what is the ratio of the total boys and girls in all schools?
In the given histogram, what percentage of students got marks less than ? (Correct to one decimal place)
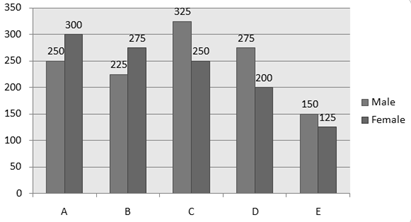
In the given bar graph, in which college, the percentage of boys is the highest?

In the given histogram. What is the mean speed of cars (in ) to the nearest Whole number?
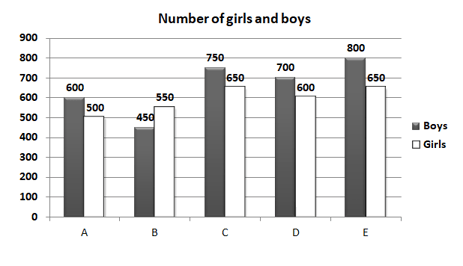
In the given bar graph, what is the average number of girls from all schools?
The given bar chart shows population of different states in years (in crores).
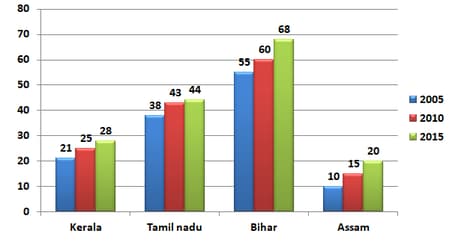
In the given bar-chart, what is the population growth (in crores) in total in states Kerala and Tamil Nadu for the period between
and
The given bar graph represents the number of boys and girls in five different schools. Read the graph and answer the question that follows.
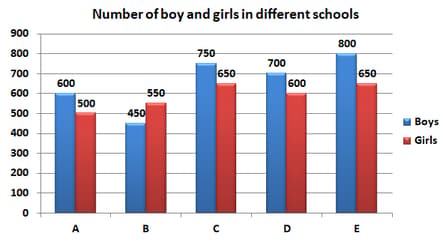
What is the average number of students (girls and boys) in schools A, B, C, D and E?
The bar graph given below presents the number of shoes manufactured by a company on the different days of a week.
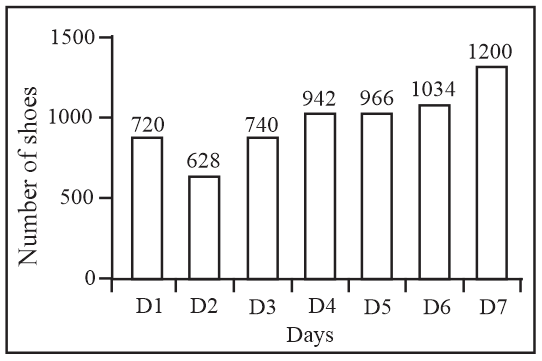
The number of shoes manufactured on is what percentage of shoes manufactured on ?


