
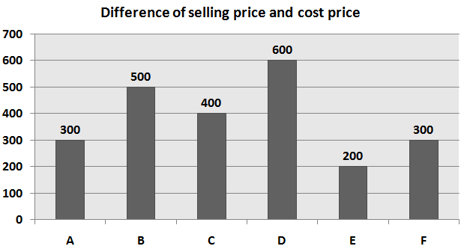
Read the given data carefully and answer the following questions. The given bar graph shows the difference of selling price and cost price for six
shopkeepers and table the mark-up percentage above the cost price.
Shopkeeper
Mark up percentage above the cost price
A
B
C
D
E
F
Shopkeeper C sells his article at a discount of and incurs a loss. Then, find the marked price marked by shopkeeper C :
shopkeepers and table the mark-up percentage above the cost price.
Important Questions on Graphical Representation of Data
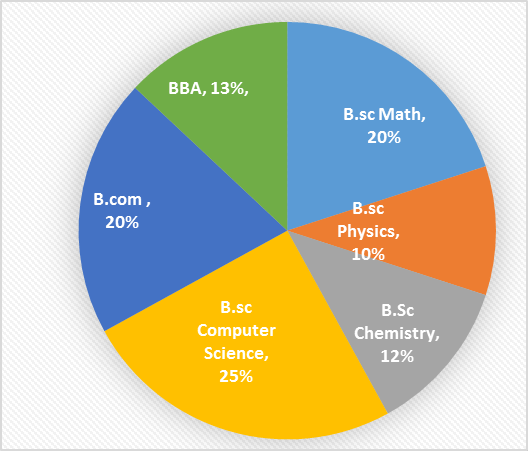
Study the given pie chart and answer the question that follows.
Total number of students admitted in a college
Distribution of the percentage of students in various courses.
 .
.
Percentage-wise distribution of the number of boys.
| Course | Number of boys |
| B.sc Math | |
| B.sc Physics | |
| B.sc Computer Science | |
| B.com | |
| B.sc Chemistry | |
| BBA |
The difference between the number of boys and the number of girls admitted in B.Com. is:
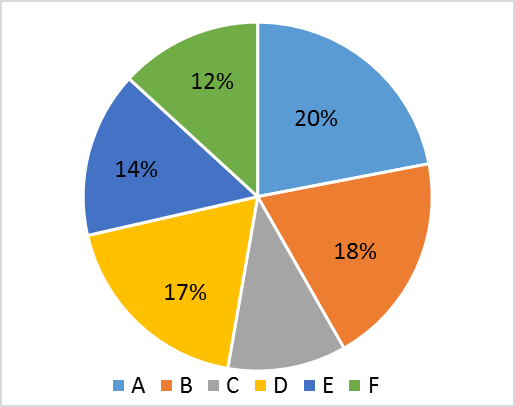
Study the given pie chart and table and answer the question that follows.
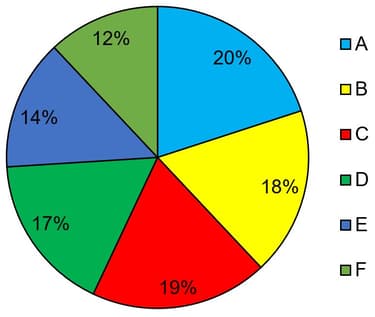
The pie chart represents the percentage wise distribution of students of class is a school in six different sections A, B, C, D, E, and F.
 .
.
The table shows the number of boys of class X in six different sections A, B, C, D, E, and F.
| Section | A | B | C | D | E | F |
| No. of boys |
If the total number of students in section C is , then the total number of girls in section C and D together will be:
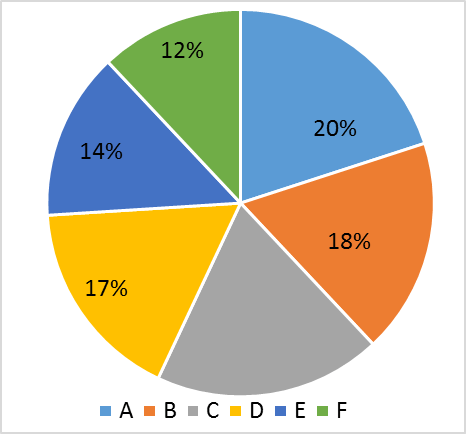
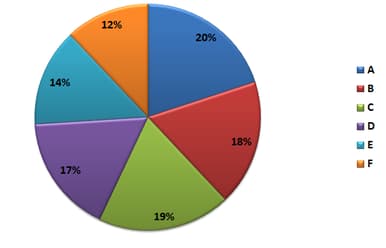
The following pie chart represents the percentage-wise distribution of students of class X in a school in six different sections A, B, C, D, E and F.

The given table shows the number of boys of class X in six different sections A, B, C, D, E and E.
| Section | A | B | C | D | E | F |
| No. of boys | ___ |
The total number of boys in sections A, B and D together is what pecentage more than the total number of girls in section A, B and D together?
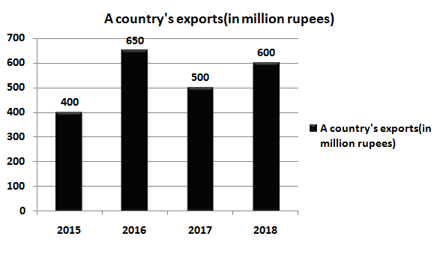
The given bar graph presents a country's exports (in million rupees) during , and the table that follows shows the break-up of goods exported in a year.

Break-Up of Goods Exported in a year
| Computers | |
| Garments | |
| Textiles | |
| Cosmetics | |
| Jewellery |
Total exports of cosmetics in four years is approx. what percent less than the total exports of Garments and Jewellery in and ?
The given pie chart represents the percentage-wise distribution of students of class X in a school in six different sections A, B, C, D, E and F.
 .
.
The given table shows the number of boys of class X in six different sections A, B, C, D, E and F.
| Sections | A | B | C | D | E | F |
| No. of boys |
If in section E, the ratio of boys and girls is , then the ratio of the number of girls in section B to that of the number of girls in section E is:
The given bar graph presents a country's exports (in million rupees) during , and the table that follows shows the break-up of goods exported in a year.

Break-Up of Goods Exported in a year
| Computers | |
| Garments | |
| Textiles | |
| Cosmetics | |
| Jewellery |
Total exports of Jewellery in and is what percent of the total exports of textiles in and ?
The following Pie chart represents the percentage-wise distribution of students of class in a school in six different sections and .
The table given below shows the number of boys of class in six different sections and .
| Section | ||||||
| Number of boys |
If in section , the ratio of the number of boys to the number of girls is , then find the ratio of the number of boys in section to the number of girls in section .
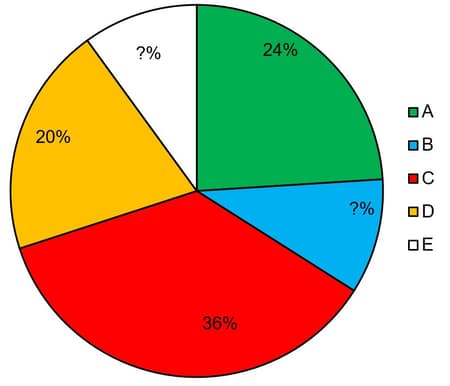
The following pie-chart and table show the percentage distribution of farmers in 5 states A, B, C, D & E of a country who claimed insurance due to drought in the year 2017 and ratio of males to females of the number of farmers in states, respectively.
Study the pie-chart and the table carefully and answer the following questions.
| State | Male : Female |
| A | 5 : 3 |
| B | 4 : 1 |
| C | - : - |
| D | 5 : - |
| E | 3 : 2 |
Note: Some data are missing in the pie-chart and table, if required in any question, find the missing data first and then answer the question Total number of farmers who claimed insurance in the year 2017 = 2,64,000
The number of farmers who claimed insurance in state C exceeds the total number of farmers (who claimed insurance) in state E and state A together by 5280. What is the percentage of farmers who claimed insurance in state E?
The following Pie chart represents the percentage- wise distribution of students of class XII in a school in six different sections A, B, C, D, E and F.
The table given below shows the number of girls of class XII in six different sections A, B, C, D, E and F.
| Section | A | B | C | D | E | F |
| Number of girls |
The total number of girls in sections B, C and D together is what percentage more than the total number of boys in sections A, B and D together?
Study the given pie chart and answer the question that follows.
Total number of students admitted in a college
Distribution of the percentage of students in various couses.
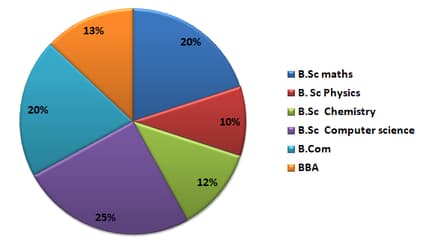
Percentage-wise distribution of the number of boys.
| Course | Number of boys |
| B.Sc. Maths | |
| B.Sc. Physics | |
| B.Sc. Chemistry | |
| B.Sc. Computer science | |
| B.Com | |
| BBA |
The ratio of the total number of girls admitted in B.Sc maths to the total number of students admitted in B.Sc maths is_____.
The given bar graph presents a country's exports (in million rupees) during , and the table that follows shows the break-up of goods exported in a year.
Break-Up of Goods Exported in a year
| Computers | |
| Garments | |
| Textiles | |
| Cosmetics | |
| Jewellery |
What is the ratio of the total exports of Computers in and to the total exports of Cosmetics in and ?
The line graph shows electricity consumption (in ) for three households A, B and C for months February to May.
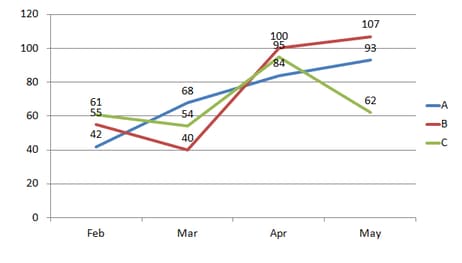
If the per- rate chart is:
| Rate per (₹) | |
| First | |
| Next | |
| Above |
In the given line graph, the electric charges collected from all (A, B and C) for the month of February is:


