
Refer to the data below and answer the questions that follow:
The bar graph shows the number of people of different religions in six different countries.
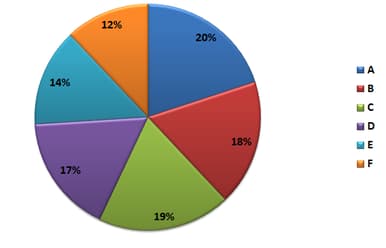
The pie-chart shows the percentage of the total land in different countries.
total land
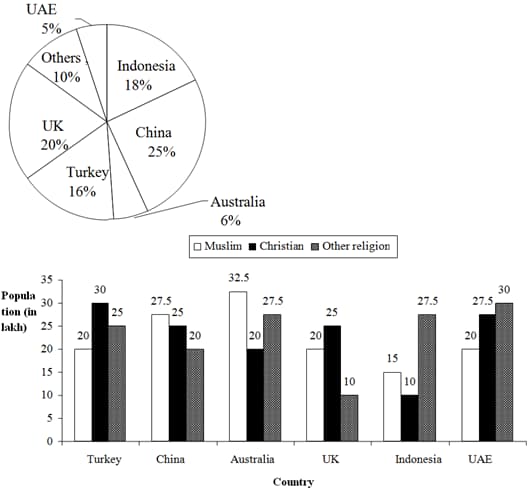
In the given countries the population of which religion is the maximum?
The pie-chart shows the percentage of the total land in different countries.
total land
Important Questions on Graphical Representation of Data
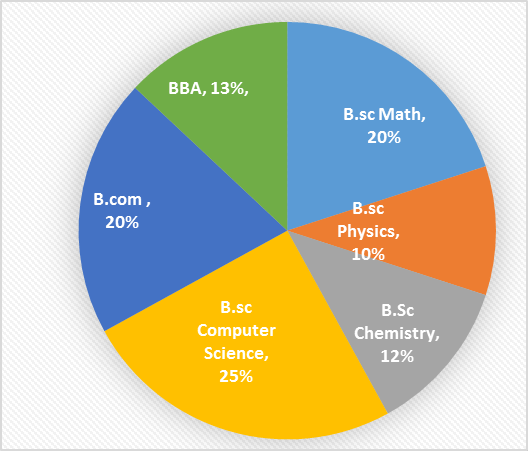
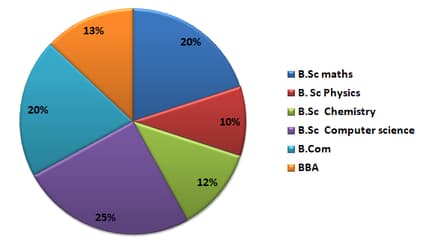
Study the given pie chart and answer the question that follows.
Total number of students admitted in a college
Distribution of the percentage of students in various courses.
 .
.
Percentage-wise distribution of the number of boys.
| Course | Number of boys |
| B.sc Math | |
| B.sc Physics | |
| B.sc Computer Science | |
| B.com | |
| B.sc Chemistry | |
| BBA |
The difference between the number of boys and the number of girls admitted in B.Com. is:
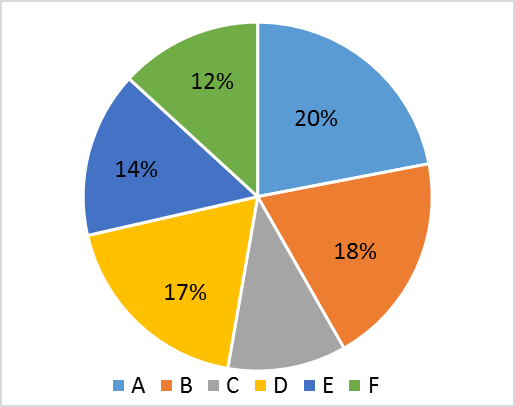
Study the given pie chart and table and answer the question that follows.
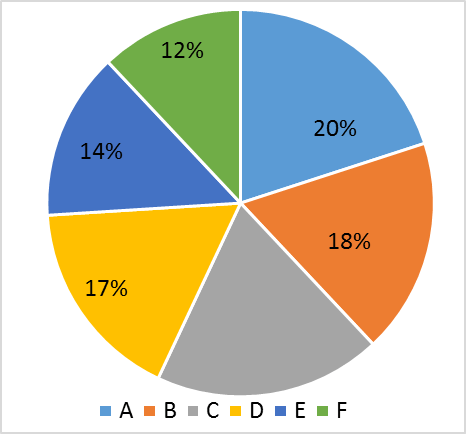
The pie chart represents the percentage wise distribution of students of class is a school in six different sections A, B, C, D, E, and F.
 .
.
The table shows the number of boys of class X in six different sections A, B, C, D, E, and F.
| Section | A | B | C | D | E | F |
| No. of boys |
If the total number of students in section C is , then the total number of girls in section C and D together will be:
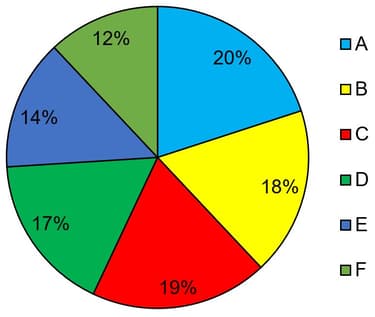
The following pie chart represents the percentage-wise distribution of students of class X in a school in six different sections A, B, C, D, E and F.

The given table shows the number of boys of class X in six different sections A, B, C, D, E and E.
| Section | A | B | C | D | E | F |
| No. of boys | ___ |
The total number of boys in sections A, B and D together is what pecentage more than the total number of girls in section A, B and D together?
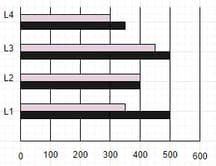
The bar chart represents number of fiction and non-fiction books in four libraries L1, L2, L3 and L4. Consider the bar chart and answer the question bsed on it -

| L1 | L2 | L3 | L4 | |
| Non-Fiction (Pink) | 350 | 400 | 450 | 300 |
| Fiction (Black) | 500 | 400 | 500 | 350 |
What is the percentage difference of total number of fiction books in libraries L3 and L4 to the non-fiction books in L3 and L4?
.
.
.
. It is the same
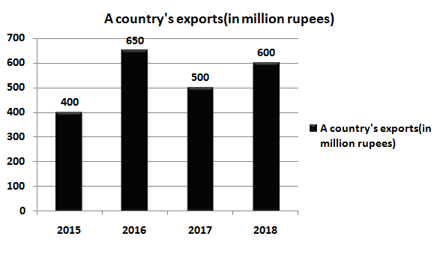
The given bar graph presents a country's exports (in million rupees) during , and the table that follows shows the break-up of goods exported in a year.

Break-Up of Goods Exported in a year
| Computers | |
| Garments | |
| Textiles | |
| Cosmetics | |
| Jewellery |
Total exports of cosmetics in four years is approx. what percent less than the total exports of Garments and Jewellery in and ?
The bar chart represents number of fiction and non-fiction books in four Libraries . Consider the bar chart and answer the question based on it.
| Non-Fiction (Pink) | ||||
| Fiction (Black) |
The ratio of total number of non-fiction to fiction books in all libraries is-
1.
2.
3.
4.
The given pie chart represents the percentage-wise distribution of students of class X in a school in six different sections A, B, C, D, E and F.
 .
.
The given table shows the number of boys of class X in six different sections A, B, C, D, E and F.
| Sections | A | B | C | D | E | F |
| No. of boys |
If in section E, the ratio of boys and girls is , then the ratio of the number of girls in section B to that of the number of girls in section E is:
Direction: Study the graph carefully to answer these question.

The foreign exchange reserve in was how many times that in ?
The given bar graph presents a country's exports (in million rupees) during , and the table that follows shows the break-up of goods exported in a year.

Break-Up of Goods Exported in a year
| Computers | |
| Garments | |
| Textiles | |
| Cosmetics | |
| Jewellery |
Total exports of Jewellery in and is what percent of the total exports of textiles in and ?
The following Pie chart represents the percentage-wise distribution of students of class in a school in six different sections and .
The table given below shows the number of boys of class in six different sections and .
| Section | ||||||
| Number of boys |
If in section , the ratio of the number of boys to the number of girls is , then find the ratio of the number of boys in section to the number of girls in section .
The bar chart represents number of fiction and non-fiction books in four libraries L1, L2, L3 and L4. Consider the bar chart and answer the question based on it:

| L1 | L2 | L3 | L4 | |
| Non-Fiction (Pink) | 350 | 400 | 450 | 300 |
| Fiction (Black) | 500 | 400 | 500 | 350 |
The ratio of total books of libraries L1 and L3 to L2 and L4 is:
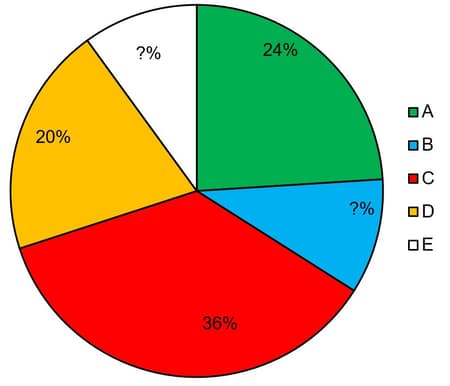
The following pie-chart and table show the percentage distribution of farmers in 5 states A, B, C, D & E of a country who claimed insurance due to drought in the year 2017 and ratio of males to females of the number of farmers in states, respectively.
Study the pie-chart and the table carefully and answer the following questions.
| State | Male : Female |
| A | 5 : 3 |
| B | 4 : 1 |
| C | - : - |
| D | 5 : - |
| E | 3 : 2 |
Note: Some data are missing in the pie-chart and table, if required in any question, find the missing data first and then answer the question Total number of farmers who claimed insurance in the year 2017 = 2,64,000
The number of farmers who claimed insurance in state C exceeds the total number of farmers (who claimed insurance) in state E and state A together by 5280. What is the percentage of farmers who claimed insurance in state E?
Direction: Study the graph carefully to answer these question.
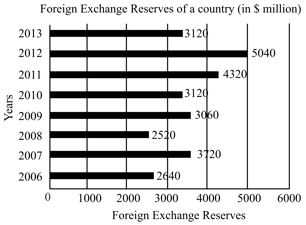
What is the percentage increase in the foreign reserves in over ?
The following Pie chart represents the percentage- wise distribution of students of class XII in a school in six different sections A, B, C, D, E and F.
The table given below shows the number of girls of class XII in six different sections A, B, C, D, E and F.
| Section | A | B | C | D | E | F |
| Number of girls |
The total number of girls in sections B, C and D together is what percentage more than the total number of boys in sections A, B and D together?
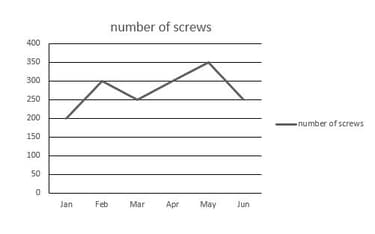
According to the chart below, in which month less than screws were manufactured?
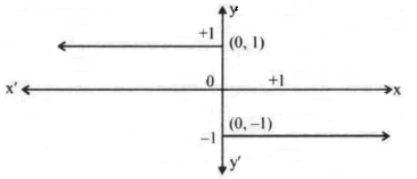
The equation of the graph shown here is:
The graph below shows three types of grains produced(in tonnes) in four states A, B, C and D.
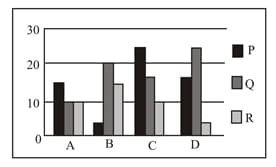
What percentage of grain Q is produced by state D out of the total quantity of Q produced by all states?
Study the given pie chart and answer the question that follows.
Total number of students admitted in a college
Distribution of the percentage of students in various couses.
Percentage-wise distribution of the number of boys.
| Course | Number of boys |
| B.Sc. Maths | |
| B.Sc. Physics | |
| B.Sc. Chemistry | |
| B.Sc. Computer science | |
| B.Com | |
| BBA |
The ratio of the total number of girls admitted in B.Sc maths to the total number of students admitted in B.Sc maths is_____.
The given bar graph presents a country's exports (in million rupees) during , and the table that follows shows the break-up of goods exported in a year.
Break-Up of Goods Exported in a year
| Computers | |
| Garments | |
| Textiles | |
| Cosmetics | |
| Jewellery |
What is the ratio of the total exports of Computers in and to the total exports of Cosmetics in and ?
The line graph shows electricity consumption (in ) for three households A, B and C for months February to May.
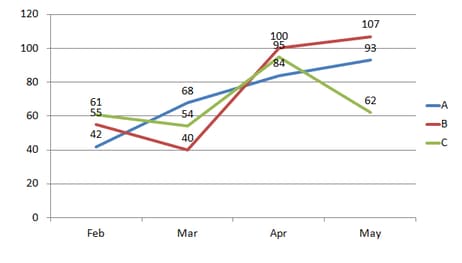
If the per- rate chart is:
| Rate per (₹) | |
| First | |
| Next | |
| Above |
In the given line graph, the electric charges collected from all (A, B and C) for the month of February is:


