
Refer to the data below and answer the questions that follow :
The following table shows the investment of (in Rs. crore) of three companies P, Q and R and the percentage profit of these companies in different years.
Income investment profit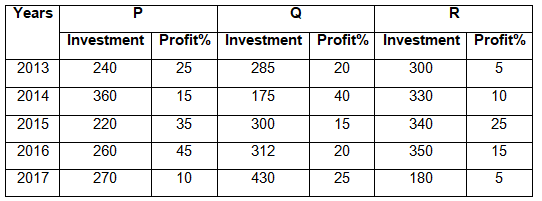
Years
P
Q
R
Investment
Profit
Investment
Profit
Investment
Profit
2013
2014
2015
2016
2017
The investment in the year 2013 by companies P, Q and R is and more than the previous year respectively and the profit percent of these companies in the year 2012 is and respectively. Find the income of the companies P, Q and R together in the year 2012.
Important Questions on Graphical Representation of Data
The given table represents the number of computers sold by four dealers A, B, C and D during the first six months of . Study the table carefully and answer the question that follows.
| Dealer/month | A | B | C | D |
| January | ||||
| February | ||||
| March | ||||
| April | ||||
| May | ||||
| June |
The number of months, in which the number of computers sold by the dealer B was less than the average number of computers sold by dealer C over six months was:
| A | B | C | D | E | TOTAL | |
| 2012 | 18 | 26 | 22 | 23 | 31 | 120 |
| 2013 | 22 | 18 | 32 | 40 | 18 | 130 |
| 2014 | 32 | 43 | 26 | 35 | 34 | 170 |
| 2015 | 18 | 22 | 26 | 14 | 20 | 100 |
| 2016 | 36 | 12 | 44 | 38 | 50 | 180 |
| 2017 | 12 | 48 | 40 | 22 | 28 | 150 |
In the year , which type of car constitutes exactly of the total numbers of cars produced that year?
|
Years Products |
2012 | 2013 | 2014 | 2015 | 2016 | 2017 |
| A | 98 | 94 | 80 | 95 | 110 | 115 |
| B | 74 | 96 | 92 | 84 | 98 | 86 |
| C | 82 | 98 | 96 | 88 | 93 | 103 |
| D | 74 | 102 | 92 | 93 | 97 | 102 |
By what percentage is the total revenue of the company from the sale of products A, B and D in and more than the total revenue from the sale of product B in to ?
The given table represents the number of computers sold by four dealers A, B, C and D during the first six months of . Study the table carefully and answer the questions that follows:
| Dealer \ \Month | A | B | C | D |
| January | 102 | 92 | 95 | 107 |
| February | 94 | 96 | 104 | 106 |
| March | 85 | 94 | 100 | 90 |
| April | 108 | 97 | 99 | 96 |
| May | 98 | 102 | 100 | 89 |
| June | 95 | 108 | 102 | 91 |
The total number of computers sold by dealer B in April, May and June is what percentage of the total nuimber of computers sold by all the dealers in Februray and April?
The given table shows the number (in thousands) of cars of five different models A, B, C, D and E produced during years . Study the table and answer the question that follow.
| A | B | C | D | E | TOTAL | |
| 2012 | 18 | 26 | 22 | 23 | 31 | 120 |
| 2013 | 22 | 18 | 32 | 40 | 18 | 130 |
| 2014 | 32 | 43 | 26 | 35 | 34 | 170 |
| 2015 | 18 | 22 | 26 | 14 | 20 | 100 |
| 2016 | 36 | 12 | 44 | 38 | 50 | 180 |
| 2017 | 12 | 48 | 40 | 22 | 28 | 150 |
The percentage increase in the total cars in over is:
The given table represents the number of computers sold by four dealers A, B, C and D during the first six months of . Study the table carefully and answer the question that follows:
| Dealer/Month | A | B | C | D |
| January | 102 | 92 | 95 | 107 |
| February | 94 | 96 | 104 | 106 |
| March | 85 | 94 | 100 | 90 |
| April | 108 | 97 | 99 | 96 |
| May | 98 | 102 | 100 | 89 |
| June | 95 | 108 | 102 | 91 |
What is the ratio of total number of computers sold by dealer A in February, April, May to the total number of computers sold by dealer D in March, May and June?
|
Years Products |
2012 | 2013 | 2014 | 2015 | 2016 | 2017 |
| A | 98 | 94 | 80 | 95 | 110 | 115 |
| B | 74 | 96 | 92 | 84 | 98 | 86 |
| C | 82 | 98 | 96 | 88 | 93 | 103 |
| D | 74 | 102 | 92 | 93 | 97 | 102 |
What is the ratio of the total revenue of the company in from the sale of all the four products to the total revenue from the sale of product C in to ?
| A | B | C | D | E | |
| Salary | |||||
| Overtime | |||||
| Arrears | |||||
| Bonus | |||||
| Miscellaneous income | |||||
| Total |
For employee D, the income from overtime is what percentage of his total income :
From the following table, how many patients were in the age group ?
| Age(years) | less than | less than | less than | less than | less than | less than | less than |
| No. of patients. |
The given table shows the number (in thousands) of cars of five different models A, B, C, D and E produced during years . Study the table and answer the question that follow.
| A | B | C | D | E | TOTAL | |
The percentage decrease in the production of which type of car in , with reference to was the maximum?
The number of students enrolled in different faculties in a school is as follows:
| Science | Arts | Commerce | Vocational | ||||
| Boys | Girls | Boys | Girls | Boys | Girls | Boys | Girls |
The percentage of students studying in Science & Vocational subjects is:
Following table gives the number of households and their corresponding monthly incomes. What will be the average monthly income of the household?
| SI.no. | No. of Households | Monthly Household income () |
As per data shown in the following table,what is the percentage of students who got less than marks?
|
Marks obtained |
|||||||
|
Number of students |
The given table represents the number of computers sold by four dealers A, B, C and D during the first six months of . Study the table carefully and answer the questions that follows:
| DealerMonth | A | B | C | D |
| January | 102 | 92 | 95 | 107 |
| February | 94 | 96 | 104 | 106 |
| March | 85 | 94 | 100 | 90 |
| April | 108 | 97 | 99 | 96 |
| May | 98 | 102 | 100 | 89 |
| June | 95 | 108 | 102 | 91 |
The total number of computers sold by dealer A during February to June is what percentage more than the total number of computers sold by all the dealers in June? (Correct to one decimal place)
The table below shows income (in rupees) for a particular month, together with their sources in respect of employees and .
| Employees | A | B | C | D | E |
| Salary | |||||
| Overtime | |||||
| Arrears | |||||
| Bonus | |||||
| Miscellaneous income | |||||
| Total |
How many employees have their salary more than four times their other incomes?
|
Years Products |
2012 | 2013 | 2014 | 2015 | 2016 | 2017 |
| A | 98 | 94 | 80 | 95 | 110 | 115 |
| B | 74 | 96 | 92 | 84 | 98 | 86 |
| C | 82 | 98 | 96 | 88 | 93 | 103 |
| D | 74 | 102 | 92 | 93 | 97 | 102 |
The number of years in which the revenue of the of company from the sale of product D is more than that the average revenue from the sale of product A over six years is:
|
Years Products |
2012 | 2013 | 2014 | 2015 | 2016 | 2017 |
| A | 98 | 94 | 80 | 95 | 110 | 115 |
| B | 74 | 96 | 92 | 84 | 98 | 86 |
| C | 82 | 98 | 96 | 88 | 93 | 103 |
| D | 74 | 102 | 92 | 93 | 97 | 102 |
The total revenue of the company from the sale of products B, C and D in is what percentage of the total revenue from the sale of products C and D in years?
The given table shows the number (in thousands) of cars of five different models A, B, C, D and E produced during years . Study the table and answer the question that follows.
| A | B | C | D | E | TOTAL | |
| 2012 | 18 | 26 | 22 | 23 | 31 | 120 |
| 2013 | 22 | 18 | 32 | 40 | 18 | 130 |
| 2014 | 32 | 43 | 26 | 35 | 34 | 170 |
| 2015 | 18 | 22 | 26 | 14 | 20 | 100 |
| 2016 | 36 | 12 | 44 | 38 | 50 | 180 |
| 2017 | 12 | 48 | 40 | 22 | 28 | 150 |
If and are put together, which type of cars constitute exactly of the total number of cars produced in those two years?
As per data in the table, what is the percentage of students who got or more marks?
| Scores | ||||||||
| No. of students |
The monthly fees for facilities provided by a sports complex house is as follows:
For Gym, for Swimming Pool , for Tennis court . The list of members using these facilities is as below. How much do they earn from members using the gym each month?
| Facilities | Number of Members |
| Gym | |
| Swimming Pool | |
| Tennis Court |


