
Sale of milk at a booth for a five months were
Days of
the week
Mon
Tue
Wed
Thur
Fri
Sat
Bottles sold
50
70
100
120
80
40
Illustrate by a bar graph
the week
Important Questions on Statistics
Number of students who scored above of marks in a class of students were English, Hindi, Maths, Science and Social studies. Represent this information by a bar graph.
The temperature at different hours of a day in a city is given by the table. Draw a line graph for the data.
| Time of the day | 3.00 | 6.00 | 9.00 | 12.00 | 15.00 | 18.00 |
| Tempreture in °C | 15° | 20° | 22° | 26° | 24° | 19° |
Depth of water in a reservoir for months is given in the table. Draw a line graph for this information.
| Months | Jan | Feb | March | April | May | June |
| Depth in cm | 800 | 700 | 600 | 400 | 500 | 900 |
Rent—, Food—, Transport—, Clothes— and school fees etc —
Draw a pie chart for the above data.
The cost of manufacturing a computer was distributed as follows. Raw Material—, Factory expenditure—, Advertisement—, Transport and Delivery— and Overheads—. Illustrate the above data by a pie chart.
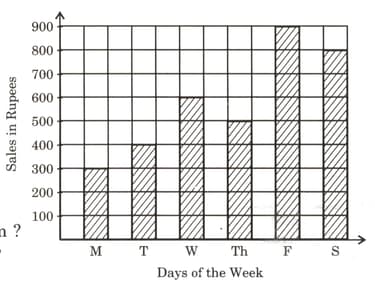
The sales for days in a week at a toy shop are given by the bar chart. Study the chart and answer the questions.
Find the sales for each day of the week.
The sales for days in a week at a toy shop are given by the bar chart. Study the chart and answer the questions.
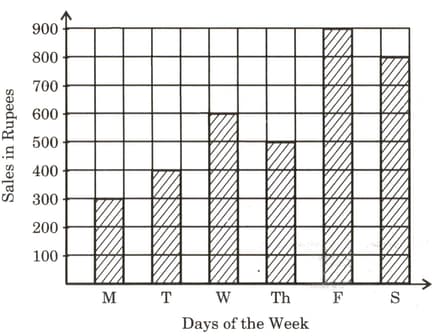
On which day the sales were the maximum ?
The sales for days in a week at a toy shop are given by the bar chart. Study the chart and answer the question.
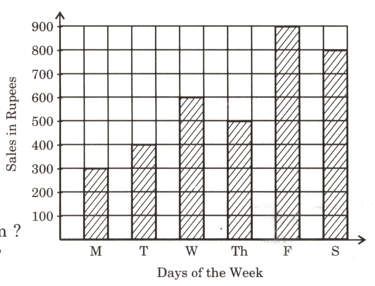
On which day the sales were the least ?


