
Scientists can influence what conclusions people draw from data by the format that they use to display it. Each point on the following graph shows the change in fertility rate and the cost of housing in one county in the US between 2010 and 2016.

What line of best fit on the graph would show the trend in the data?
Important Questions on Reproduction
Scientists can influence what conclusions people draw from data by the format that they use to display it. Each point on the following graph shows the change in fertility rate and the cost of housing in one county in the US between 2010 and 2016.

What conclusion do you draw from this graph?
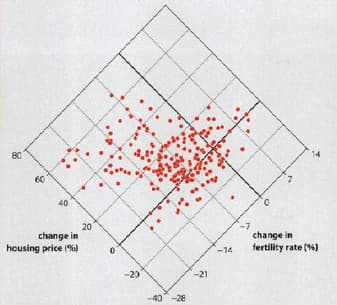
Evolutionary biologist Carl Bergstrom and information scientists Jevin West have suggested a new way of presenting data - a diamond plot. The following graph shows the same data as the previous graph, but in a diamond plot.

What line of best fit on diamond plot would show trend in the data?
Evolutionary biologist Carl Bergstrom and information scientists Jevin West have suggested a new way of presenting data - a diamond plot. The following graph shows the same data as the previous graph, but in a diamond plot.

What conclusion is most likely to be drawn from the diamond plot?
Evolutionary biologist Carl Bergstrom and information scientists Jevin West have suggested a new way of presenting data - a diamond plot. The following graph shows the same data as the previous graph, but in a diamond plot.

Does the data in the diamond plot support the claim that women choose to have fewer children when their living standards rise? Explain your answer fully.
Evolutionary biologist Carl Bergstrom and information scientists Jevin West have suggested a new way of presenting data - a diamond plot. The following graph shows the same data as the previous graph, but in a diamond plot.
Discuss the factors that might influence a woman's personal choice about how many children to have.


