
EASY
6th CBSE
IMPORTANT
Earn 100
See the following data :
From the above data, the frequency of is
From the above data, the frequency of is
50% studentsanswered this correctly
Important Questions on Data Handling
EASY
6th CBSE
IMPORTANT
A bar graph is given below :
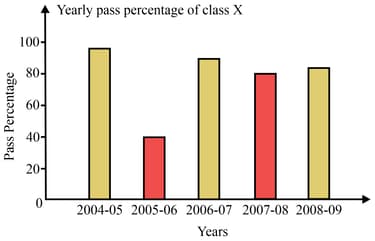
The pass percentage in was
EASY
6th CBSE
IMPORTANT
In the bar graph of

the graph shows the minimum result in
EASY
6th CBSE
IMPORTANT
EASY
6th CBSE
IMPORTANT
EASY
6th CBSE
IMPORTANT
Graphs give us a general impression about the data at a glance.
EASY
6th CBSE
IMPORTANT
represents the number .
EASY
6th CBSE
IMPORTANT
Pictograph does not mean picture graph.
MEDIUM
6th CBSE
IMPORTANT


