
Select the incorrect options from the given statements.
(i) Pyramids of energy and yearly biomass production can never be inverted since this would violate the laws of thermodynamics.
(ii) Pyramids of standing crop and numbers can be inverted since the number of organisms at a time does not indicate the amount of energy flowing through the system.
(iii) There are certain limitations of ecological pyramids such as they do not take into account the same species belonging to two or more trophic levels.
(iv) Saprophytes are not given any place in ecological pyramids even though they play a vital role in the ecosystem.
Important Questions on Ecosystem
Choose and write the correct option:
The pyramid of energy is:
Secondary consumer : 120 g
Primary consumer : 60 g
Primary producer : 10 g
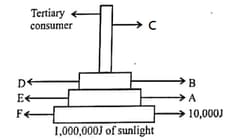
Write the suitable names of A, B, C, D, E and F in the given picture.
(i) The trophic relationship is expressed in terms of numbers, biomass or energy arranged one on the top of its lower trophic level, resulting in a pyramid shape.
(ii) The base of each pyramid represents producers, while the apex represents the top order consumers.
(iii) The pyramid of biomass in sea is generally upright.
(iv) In the case of parasite food chain, the pyramid of number is inverted.
(v) Some species belonging to two or more trophic levels is not limitation of ecological pyramid.
Given below is data showing number of individuals and dry weight of different trophic levels in a grassland ecosystem. Construct:
Pyramid of Biomass
| Trophic Level | Number of individuals | Dry weight (Kg m-2) |
| Primary Producer | 5,84,2000 | 809 |
| Primary consumer | 7,08,000 | 37 |
| Secondary consumer | 3.54,000 | 11 |
| Tertiary consumer | 3 | 1.5 |
Given below is data showing number of individuals and dry weight of different trophic levels in a grassland ecosystem. Construct:
Pyramid of number
| Trophic Level | Number of individuals | Dry weight (Kg m-2) |
| Primary Producer | 5,84,2000 | 809 |
| Primary consumer | 7,08,000 | 37 |
| Secondary consumer | 3.54,000 | 11 |
| Tertiary consumer | 3 | 1.5 |


