
Show the following information by percentage bar graph.
Division of standard
A
B
C
D
Number of students securing grade A
Total number of students
Important Questions on Statistics
Observe the following graph and answer the question:
The type of the bar graph is _____ bar graph
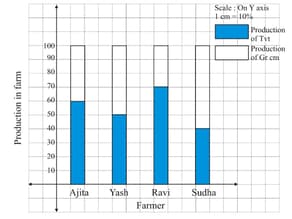
Observe the graph and answer the question:
If the Tur production to total production in Ajita’s farm is , then find the value of .
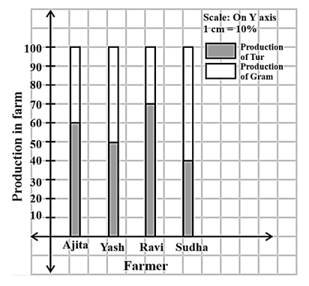
Observe the graph and answer the question:
Compare the production of Gram in the farms of Yash and Ravi and state whose percentage of production is more and by how much ?
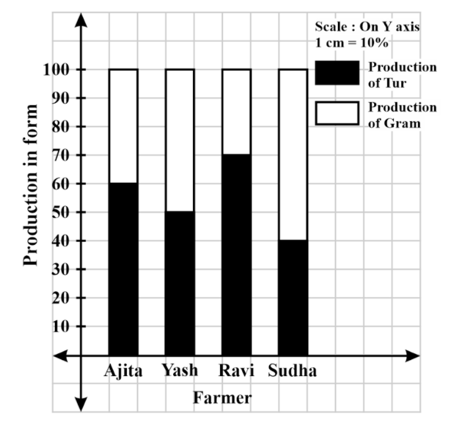
Observe the graph and answer the question:
Name the person whose percentage production of Tur is the least.
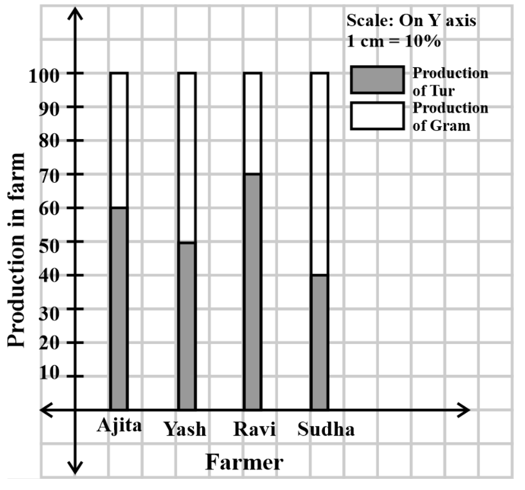
Observe the graph and answer the question:
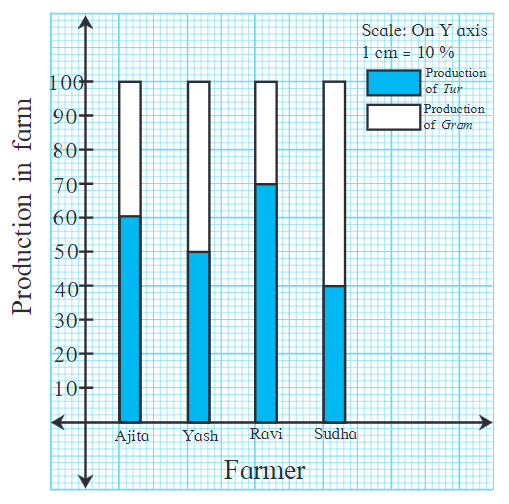
State production percentages of Tur and gram in Sudha’s farm.
The following data is collected in a survey of some students of standard from some schools. Draw the percentage bar graph of the data.
| School | st | nd | rd | th |
| Inclination towards science stream | ||||
| Inclination towards commerce stream |


