
Shown below are number line representation of the medians of two different data sets.

Which of the two representations of median could be correct?
Important Questions on Statistics
In statistics, an outlier is a data point that differs significantly from other observations of data set. If an outlier is included in the following data set, which measure(s) of central tendency would change?
An incomplete distribution is given below:
| Variable | |||||||
| Frequency | _____ | _____ |
You are given that the median value is and the total number of items is .
(i) Using the median formula, fill up the missing frequencies.
(ii) Calculate the A.M. of the completed distribution.
surnames were randomly picked up from a local telephone directory.

The frequency distribution of the number of letters in the English alphabet in the surnames was obtained as follows
| Number of letters | ||||||
| Number of surnames |
Determine the median number of letters in the surnames. Find the mean number of letters in the surnames? Also, find the modal size of the surnames up to two places after decimal point.
If the median of observations, given below is , find the values of and .
| Class interval | ||||||
| Frequency |
Find the missing frequencies in the following frequency distribution table, if the total frequency is and mode is .
| Class | ||||||||
| Frequency |
A TV reporter was given a task to prepare a report on the rainfall of the city Dispur of India in a particular year. After collecting the data, he analysed the data and prepared a report on the rainfall of the city. Using this report, he drew the following graph for a particular time period of days.
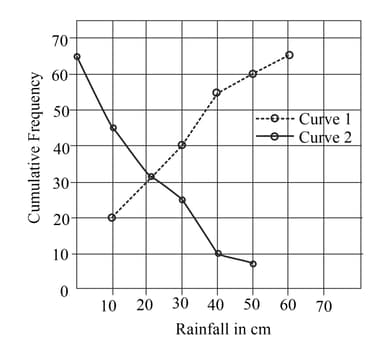
Obtain the mode of the data if mean rainfall is
The pyramid graph below shows the ages of the 548 Members of Parliament in the 17th Lok Sabha.
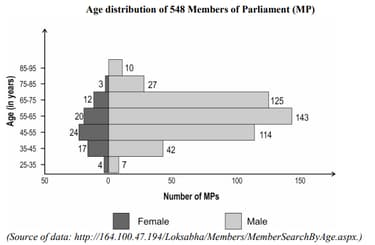
On an average, how much younger is a female MP than a male MP? Round your answer to the nearest whole number and show your work.
The table below gives the percentage distribution of female teachers in the primary schools of rural areas of various states and union territories (U.T.) of India. Find the mean percentage of female teachers by all three methods.
| Percentage of female teachers | |||||||
| Number of States/U.T. |


