
Some of the cell frequencies in a bivariate frequency table may be
Important Questions on Graphical Representation of Data
The radar graph given below shows the sales (by units) of three models of two-wheelers by a company. Models of two-wheelers sold by the company are Activa, Kawasaki, and Enfield. Study the graph and answer the following question.

What is the ratio of sales of Enfield in 2015 to the sales of Kawasaki in 2013?
The radar graph given below shows the production of steel by three companies (in million tonnes) from 2010 to 2015. Study the graph and answer the following question.

By what percentage is the production in the year 2010 less than in the year 2015?
The radar graph given below shows the sales (by units) of three models of two-wheelers by a company. Models of two-wheelers sold by the company are Activa, Kawasaki, and Enfield. Study the graph and answer the following question:
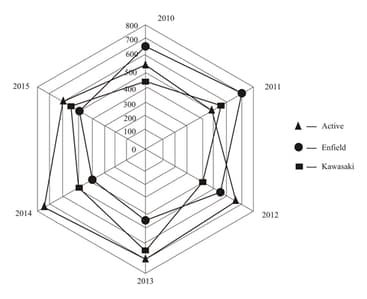
What is the difference between the sales of Activa and Enfield for all the years?
Study the radar graph carefully and answer the question that follows:
The graph represents number of students (in thousands) in two different universities in six different years.

If 25% of the students in university 2 in the year 2010 were females, what was the number of male students in the university 2 in the same year?
The radar graph given below shows the expenditure (in crores) of six automobile factories in Study the graph and mark the correct answer.
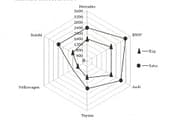
If Audi has to recall some of its cars due to some technical issues and due to that its expenditure is further increased by 7% then what is the approximate percentage profit of Audi?
The radar graph given below shows the number of patients (in thousands) admitted in six hospitals in 2014. Study the graph and mark the appropriate answer.

Which hospital has the maximum number of patients admitted In three years together?
The radar graph given below shows the expenditure (in crores) of six automobile factories in Study the graph and mark the correct answer.
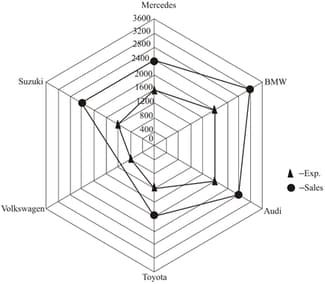
Total expenditure for Mercedes and Suzuki together is what percentage of the total sales revenue of Toyota and Volkswagen together?
The radar graph given below shows the sales (by units) of three models of two-wheelers by a company. Models of two-wheelers sold by the company are Activa, Kawasaki, and Enfield. Study the given graph and answer the following question:

If the profits earned on selling one unit of Enfield and Kawasaki are Rs. 4200 and Rs. 7500 respectively, then what is the difference between the profits generated from the sales of Kawasaki and Enfield in 2014?
The radar graph given below shows the production of steel by three companies (in million tonnes) from 2010 to 2015. Study the graph and answer the following question.
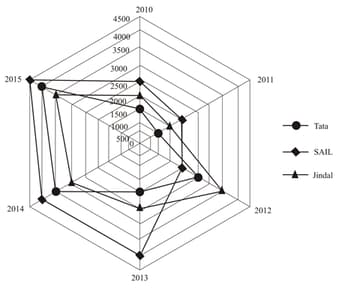
What is the total production of steel (million tonnes) in 2011, 2012 and 2013 together?
The radar graph given below shows the production of steel by three companies (in million tonnes) from 2010 to 2015. Study the given graph and answer the following question:
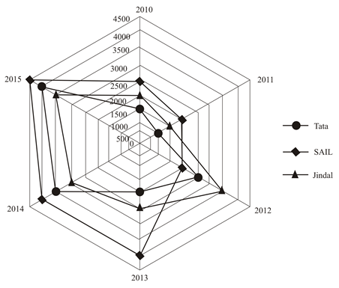
Which of the following statements is true?
Study the radar graph carefully and answer the questions that follows:
The graph represents number of students (in thousands) in two different universities in six different years.
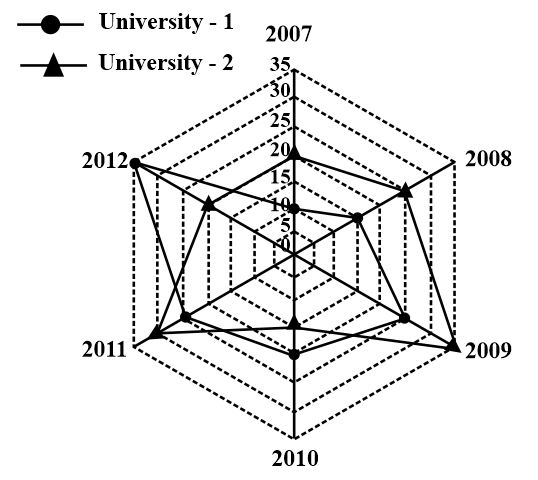
What was the difference between the number of students in university 1 in the year 2010 and the number of students in university 2 in the year 2012?
The radar graph given below shows the expenditure (in crores) of six automobile factories in 2015. Study the graph and mark the correct answer.

For which company, the expenditure as a percentage of sales revenue is the minimum?
The radar graph given below shows the sales (by units) of three models of two-wheelers by a company. Models of two-wheelers sold by the company are Activa, Kawasaki, and Enfield. Study the following graph and answer the question:
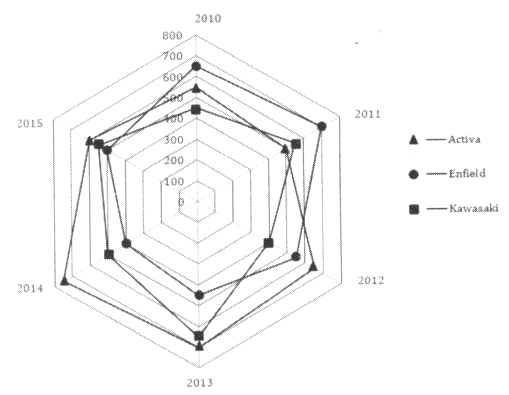
The sales of Kawasaki in 2011 are approximately what percentage of the sales of Activa in 2014?
Study the radar graph carefully and answer the question that follows:
The graph represents number of students (in thousands) in two different universities in six different years.

In which year was the difference between the number of students in university-1 and the number of students in university-2 highest ?
The radar graph given below shows the number of patients (in thousands) admitted in six hospitals in 2014. Study the graph and mark the appropriate answer.
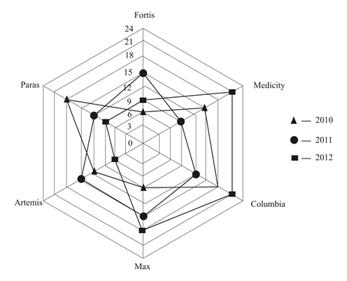
If one-third of patients admitted to Fortis In 2011 were heart patients and the ratio of male to female heart patients was 5:3, then how many female patients for heart problems were admitted to Fortis?
The radar graph given below shows the number of patients (in thousands) admitted in six hospitals in . Study the graph and mark the appropriate answer.
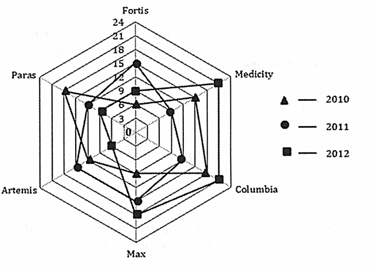
What is the ratio of the total number of patients admitted in and ?
The radar graph given below shows the production of steel by three companies (in million tonnes) from 2010 to 2015. Study the given graph and answer the following question.
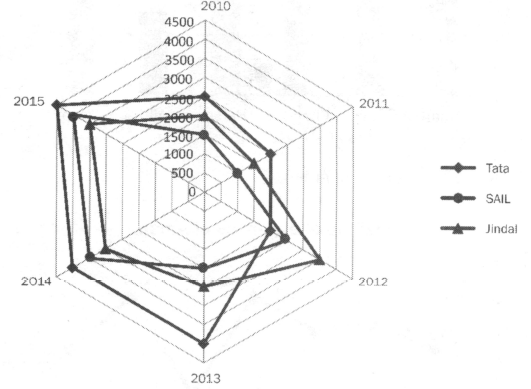
Production of Tata in 2011 is what percentage of production of Jindal in 2013?
The radar graph given below shows the production of steel by three companies (in million tonnes) from to . Study the given graph and answer the following question.
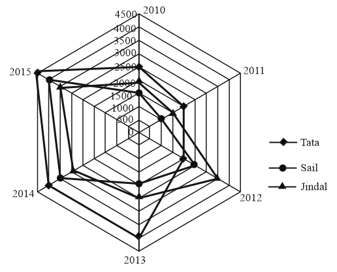
What is the ratio of production of Tata for all years together to the production of SAIL for all years together?
Study the radar graph carefully and answer the question that follows:
The graph represents number of students (in thousands) in two different universities in six different years.

What was the percent increase in the number of students in university in the year as compared to the previous year?


