
Some students investigated what size of quadrat they should use to assess the abundance of plant species in an old-field ecosystem. They used the quadrats os side 10, 25, 50, 75 and 100 cm and recorded how many plant species were present. They repeated their investigation five times and calculated mean numbers of species per quadrat. Their results are in the given graph.
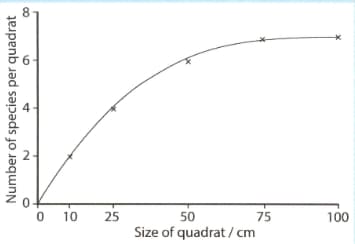
Calculate the area of each quadrat that the student used.
Important Questions on Classification Biodiversity and Conversation
Some students investigated what size of quadrat they should use to assess the abundance of plant species in an old-field ecosystem. They used the quadrats of sides 10, 25, 50, 75 and 100 cm and recorded how many plant species were present. They repeated their investigation five times and A quadrat is a frame, traditionally square, used in ecology and geography to isolate a standard unit of area for the study of the distribution of an item over a large area. Their results are in the given graph.

Explain why the students took five results for each quadrat.
Some students investigated what size of quadrat they should use to assess the abundance of plant species in an old-field ecosystem. They used the quadrats of side 10, 25, 50, 75 and 100 cm and recorded how many plant species were present. They repeated their investigation five times and A quadrat is a frame, traditionally square, used in ecology and geography to isolate a standard unit of area for the study of the distribution of an item over a large area. Calculated mean numbers of species per quadrat. Their results are in the given graph.

Based on the results, the students decided to use the 50 cm quadrat to study the old field. Why did they choose the 50 cm quadrat?
Some students investigated what size of quadrat they should use to assess the abundance of plant species in an old-field ecosystem. They used the quadrats of sides 10, 25, 50, 75 and 100 cm and recorded how many plant species were present. They repeated their investigation five times and A quadrat is a frame, traditionally square, used in ecology and geography to isolate a standard unit of area for the study of the distribution of an item over a large area. Calculated mean numbers of species per quadrat. Their results are in the given graph.
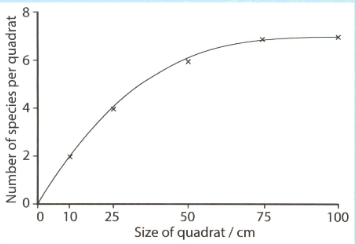
Explain how the students will use the 50 cm quadrat to estimate the abundance of different plant species in the field.
Five 0.25 m2 quadrats were placed randomly in an area of grassland in the UK. The percentage of each quadrant occupied by each species of plant was estimated to the nearest 5% and recorded in the table.
Calculate the mean percent cover for the first two species in the table.
Five 0.25 m2 quadrats were placed randomly in an area of grassland in the UK. The percentage of each quadrat occupied by each species of plant was estimated to the nearest 5% and recorded in the table.
Explain why the percentage cover for all the species in each quadrat adds up to more than 100%.
Five 0.25 m2 quadrats were placed randomly in an area of grassland in the UK. The percentage of each quadrant occupied by each species of plant was estimated to the nearest 5% and recorded in the table.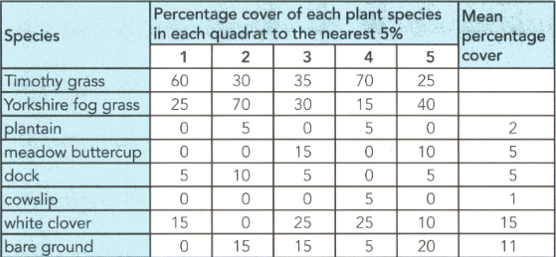
Suggest why the percentage cover was recorded to the nearest 5%.
Five 0.25 m2 quadrats were placed randomly in an area of grassland in the UK. The percentage of each quadrat occupied by each species of plant was estimated to the nearest 5% and recorded in the table.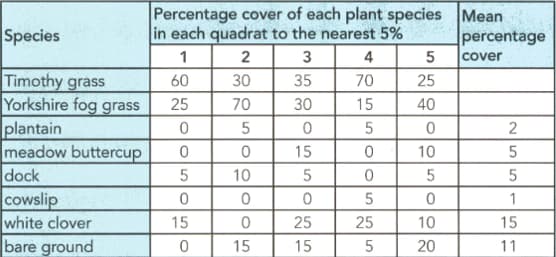
Could these results are used to obtain a valid estimate of the species frequency for each species? Explain your answer.
Suggest four factors that affect plant biodiversity in a field ecosystem.


