
Stoneflies, Plecoptera spp., lay eggs in freshwater streams and rivers. The eggs hatch into nymphs which live in the water for several years before changing to adults. Stonefly nymphs are known as good indicators of pollution since they are very sensitive to a decrease in the oxygen concentration of the water. A biologist wanted to know whether the stonefly nymphs would be suitable as an indicator of water hardness. She collected samples from 12 streams and obtained values of calcium carbonate concentration from the local water authority. The number of nymphs and concentration of calcium carbonate are given in the table.

Use the given data and find the Spearman's correlation coefficient. What can you conclude from your calculation.
Important Questions on Classification Biodiversity and Conversation
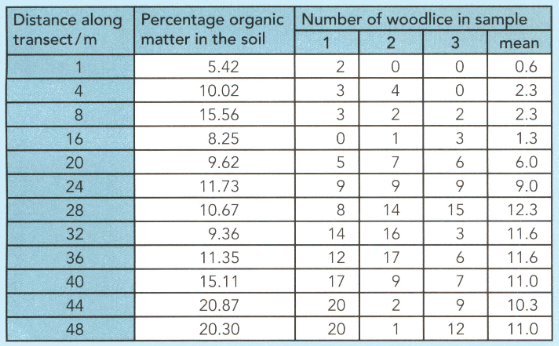
To find the relationship between the number of woodlice and the organic content of soil, a student used the line transect method. At each point along the transect, he Took a sample of soil. Counted the number of woodlice in three separate samples of leaf litter from the surface of the soil.
His results are shown in the table.

Explain why the student has taken three samples of woodlice at each point along the transect.
A student noticed that there seemed to be more woodlice in areas where there was plenty of leaf litter and organic matter. He also noticed that there appeared to be more leaf litter towards the middle of the wood than at the edge. To find the relationship between the number of woodlice and the organic content of the soil, a student used the line transect method. At each point along the transect, he Took a sample of soil. Counted the number of woodlice in three separate samples of leaf litter from the surface of the soil.
His results are shown in the table.

Suggest three further pieces of information you would need if you were to repeat the student’s investigation.
A student noticed that there seemed to be more woodlice in areas where there was plenty of leaf litter and organic matter. He also noticed that there appeared to be more leaf litter towards the middle of the wood than at the edge. To find the relationship between the number of woodlice and the organic content of the soil, a student used the line transect method. At each point along the transect, he Took a sample of soil. Counted the number of woodlice in three separate samples of leaf litter from the surface of the soil.
His results are shown in the table.
Draw scatter graph to see if there is any relationship between the number of woodlice and the mass of organic matter in the soil.
A student noticed that there seemed to be more woodlice in areas where there was plenty of leaf litter and organic matter. He also noticed that there appeared to be more leaf litter towards the middle of the wood than at the edge. To find the relationship between the number of woodlice and the organic content of the soil, a student used the line transect method. At each point along the transect, he Took a sample of soil. Counted the number of woodlice in three separate samples of leaf litter from the surface of the soil.
His results are shown in the table.

State the null hypothesis for this investigation.
A student noticed that there seemed to be more woodlice in areas where there was plenty of leaf litter and organic matter. He also noticed that there appeared to be more leaf litter towards the middle of the wood than at the edge. To find the relationship between the number of woodlice and the organic content of the soil, a student used the line transect method. At each point along the transect, he Took a sample of soil. Counted the number of woodlice in three separate samples of leaf litter from the surface of the soil.
His results are shown in the table.

Carry out the Spearman’s correlation test on the data to see if there is any relationship between the number of woodlice and the mass of organic matter in the soil.
A student noticed that there seemed to be more woodlice in areas where there was plenty of leaf litter and organic matter. He also noticed that there appeared to be more leaf litter towards the middle of the wood than at the edge. To find the relationship between the number of woodlice and the organic content of the soil, a student used the line transect method. At each point along the transect, he Took a sample of soil. Counted the number of woodlice in three separate samples of leaf litter from the surface of the soil.
His results are shown in the table.

Carry out the Spearman’s correlation test on the data to see if there is any relationship between the number of woodlice and the mass of organic matter in the soil. What conclusions can you make from this data?
Reasearchers investigated aspects of the anatomy of the Melina tree, Gmelina arborea which has been introduced into wet and dry forests in Costa Rica. The researchers wanted to know if the diameter of the trees at the head height was correlated with the overall height of the trees. The table shows the data for seven trees from each type of forest. The researchers calculated the Pearson’s correlation coefficient for the two areas as: The coefficient at p=0.05 for samples of this size is 0.75.
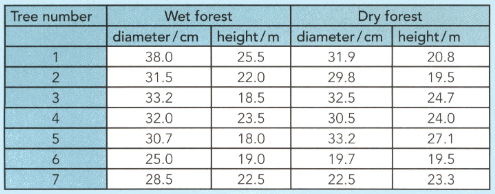
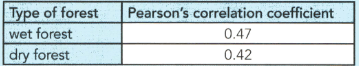
Explain what conclusions the researchers should make from these results.
Reasearchers investigated aspects of the anatomy of the Melina tree, Gmelina arborea which has been introduced into wet and dry forests in Costa Rica. The researchers wanted to know if the diameter of the trees at the head height was correlated with the overall height of the trees. The table shows the data for seven trees from each type of forest. The researchers calculated the Pearson’s correlation coefficient for the two areas as: The coefficient at p=0.05 for samples of this size is 0.75.


Explain why the researchers chose to calculate the Pearson’s correlation coefficient and not the Spearman’s rank correlation coefficient.


