
Study the adjacent bar graph showing the number of students playing different games in a school.
Which is the least popular game?
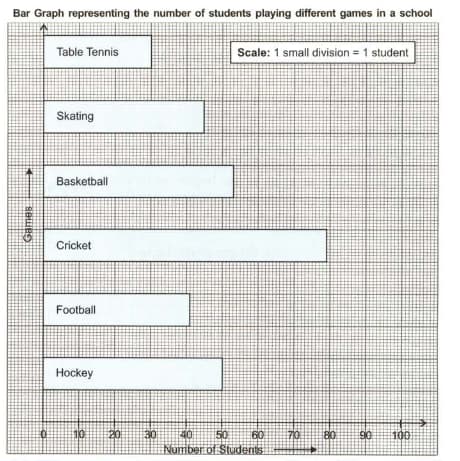
Which is the least popular game?
Important Questions on Data Handling
| State | Punjab | Delhi | Kerala | Karnataka | Tamil Nadu | Bihar | Odisha |
| Literacy Rate ( age) |
The following data shows the monthly income and expenditure of a business family in different months. Draw separate bar graphs for representing income and expenditure of the family.
| Month | Income (in thousand) |
Expenditure (in thousand) |
| Jan. | ||
| Feb. | ||
| March | ||
| April | ||
| May | ||
| June |
Given below is the data showing the sale of books in a bookshop on weekdays.
| Days | Monday | Tuesday | Wednesday | Thursday | Friday | Saturday |
| No.of Books Sold |
Draw a bar graph using a suitable scale.
Study the population of various cities at a certain period of time.
| City | Delhi | Mumbai | Kolkata | Chennai | Bengaluru | Hyderabad |
| Population (in lakhs) |
Draw a bar graph using a suitable scale and answer the following questions:
Name the least populated city.
Study the population of various cities at a certain period of time.
| City | Delhi | Mumbai | Kolkata | Chennai | Bengaluru | Hyderabad |
| Population (in lakhs) |
Draw a bar graph using a suitable scale and answer the following question:
What is the total population of all cities?
Study the population of various cities at a certain period of time.
| City | Delhi | Mumbai | Kolkata | Chennai | Bengaluru | Hyderabad |
| Population (in lakhs) |
Draw a bar graph using a suitable scale and answer the following question:
How many cities have a population of more than 1 crore?
Study the population of various cities at a certain period of time.
| City | Delhi | Mumbai | Kolkata | Chennai | Bengaluru | Hyderabad |
| Population (in lakhs) |
Draw a bar graph using a suitable scale and answer the following question:
What is the difference between the populations of the least and the most populated city?
| Year | ||||||
| Price of Wheat (per kg) |


