
Study the bar graph representing the number of persons in various age groups in a town shown in Figure. Observe the bar graph and answer the following question:
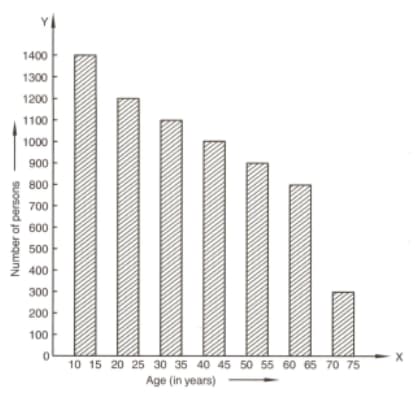
Whether the population in general increases decreases or remains constant with the increase in the age-group.
Important Questions on Graphical Representation of Statistical Data
Read the bar graph shown in figure and answer the following questions:

(i) What is the information given by the bar graph?
Read the bar graph shown in figure and answer the following questions:
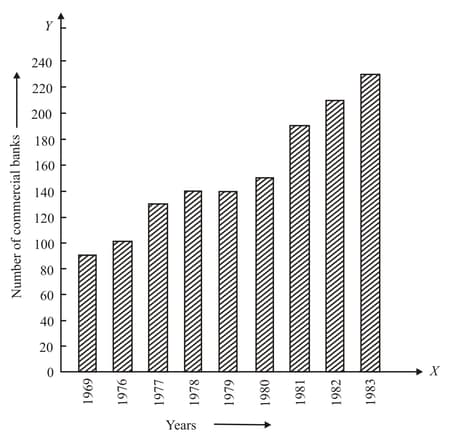
What was the number of commercial banks in ?
Read the bar graph shown in figure and answer the following questions:

(iii) What is the ratios of number of commercial banks in to that of the ?
Read the bar graph shown in the figure and answer the following questions:
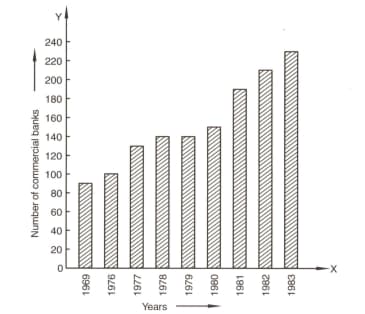
State whether true or false:
The number of commercial bank in is less than double of the number of commercial bank in
Given below figure is the bar graph indicating the marks obtained out of in mathematics paper by Students. Read the bar graph and answer the following questions:
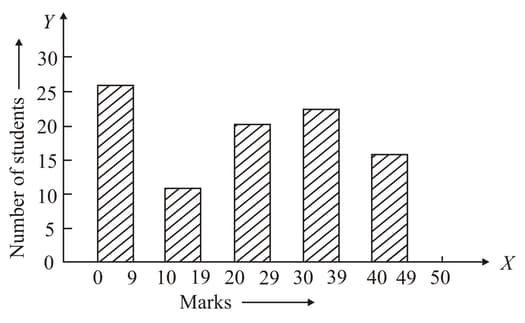
It is decided to distribute workbooks on mathematics to the students obtaining less than marks, giving one workbook to each of such students. If a workbook costs, what sum is required to buy the workbooks?
Given below figure is the bar graph indicating the marks obtained out of in mathematics paper by students. Read the bar graph and answer the following questions:
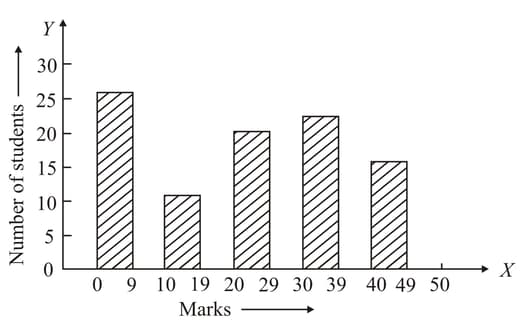
Every student belonging to the highest mark group is entitled to get a prize of the. How much amount of money is required for distributing the prize money?
Given below figure is the bar graph indicating the marks obtained out of the in mathematics paper by Students. Read the bar graph and answer the following questions:
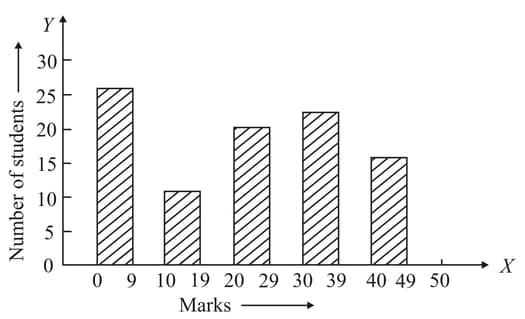
Every student belonging to the lowest mark-group has to solve problems per day. How many problems, in all, will be solved by the students of this group per day?
Given below figure is the bar graph indicating the marks obtained out of in mathematics paper by students. Read the bar graph and answer the following questions:
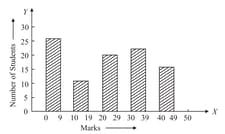
State whether true or false.
Students have obtained marks ranging from to .


