
Study the following graph carefully and answer the questions given below it. The no. of students who joined and left the school in the beginning of year for six years, from 1993 to 1998.
Initial strength of the school in 1992 = 1500
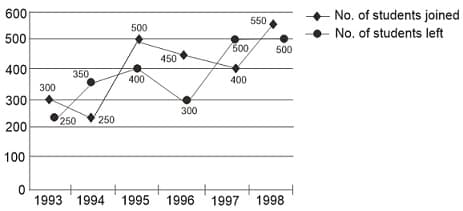
How many students were there in the school during the year 1996?
Important Questions on Averages
Average of three numbers and is more than the average of and . Average of and is .
Quantity : Find .
Quantity : .
The following line graph gives the profit earned by two companies and during the period . Study the line graph and answer the question that is based on it.
Profit Earned by Two Companies and over the given Years
ProfitLoss (Income Expenditure)Expenditure
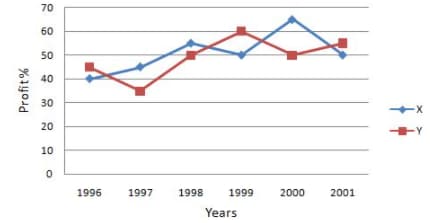
If the incomes of the two Companies were equal in , then what was the ratio of expenditure of company to that of Company in ?
Study the following graph carefully to answer these questions.
Investments (in ) of two business partners and .
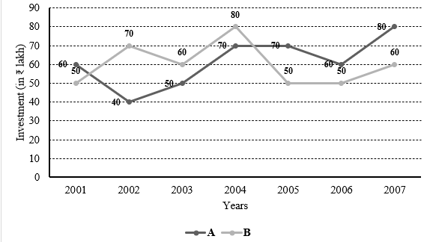
What was the per cent rise in investment in from the previous year?
Ratio of Value of Imports to Exports by a Company over the Years
The imports were minimum proportionate to the exports of the company in the year:
In a school, the periodical examinations are held every second month. A student of Class appeared for each of the periodical exams. The aggregate marks obtained by him in each periodical exam are represented in the line graph given below. Study the graph and answer the questions based on it.

Maximum Total Marks in each Periodical Exam
What are the average marks obtained by the student in all the periodical exams during the session?
In a school, the periodical examinations are held every second month. A student of Class appeared for each of the periodical exams. The aggregate marks obtained by him in each periodical exam are represented in the line graph given below. Study the graph and answer the questions based on it.
Maximum Total Marks in each Periodical Exam
The total number of marks obtained in is what per cent of the total marks obtained in ?Investments (in ) of two business partners and

What was the per cent rise in investment of in from ?
The following line-graph gives the percentage of the number of candidates who qualified an examination out of the total number of candidates who appeared for the examination over a period of seven years from . Study the graph and answer the questions based on it. Percentage of candidates qualified to appeared in an examination over the years:
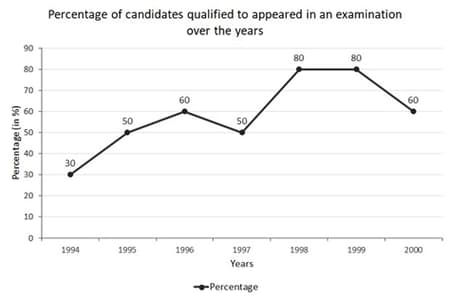
If the number of candidates qualified in was , what was the number of candidates appeared in ?
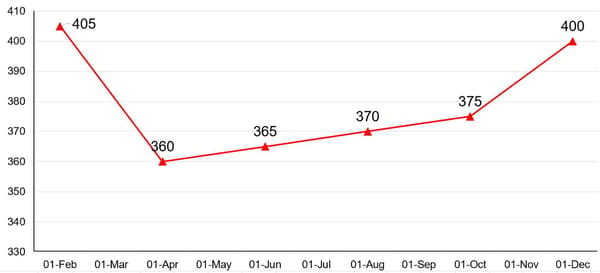
Profit Earned by a Company during Various Years (profit earned in lakhs)
Profit = Income - Expenditure
If the income of the company in the year 2007 was Rs.45 lakhs, what was the expenditure of the company in that year?
What is the percentage increased from 1993 to 1992?
Profit Earned by a Company during Various Years (profit earned in lakhs)
Profit = Income - Expenditure

What is the respective ratio of the profit earned by the company in the year 2005 to the profit earned by the company in the year 2009?
The following line-graph gives the ratio of the amounts of imports by a Company to the amount of exports from that company over the period from to . The questions given below are based on this graph. Ratio of Value of Imports to Exports by a Company over the Years:
Ratio of value of Imports to Exports
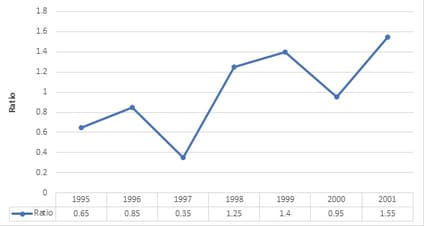
If the imports of the company in was , the exports from the Company in was:
Ratio of Value of Imports to Exports by a Company over the Years

What was the percentage increase in imports from to
Profit Earned by a Company during Various Years (profit earned in lakhs)
Profit = Income - Expenditure

If the expenditure of the company in the year 2009 was Rs. 28 lakhs, what was the income of the company in the year?


