
MEDIUM
IBPS Clerk Prelims
IMPORTANT
Earn 100
Study the following pie-chart and the table and answer the question based on them.
The proportion of the population of seven villages in
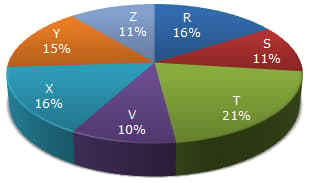
Village
% of Population below poverty line
X
Y
Z
R
S
T
V
If in , the population of village R increases by while that of village Z reduces by compared to that in and the percentage of population below poverty line remains unchanged for all the villages, then find the approximate ratio of population of village R below poverty line to the ratio of population of village Z below poverty line for the year .
16.67% studentsanswered this correctly
Important Questions on Quantitative Aptitude Practice Book
MEDIUM
IBPS Clerk Prelims
IMPORTANT
Directions : The circle-graph given here shows the spendings of a country on various sports during a particular year. Study the graph carefully and answer the question given below it.

How much percent more is spent on Hockey than that on Golf?
MEDIUM
IBPS Clerk Prelims
IMPORTANT
The circle-graph given here shows the spendings of a country on various sports during a particular year. Study the graph carefully and answer the question given below it.
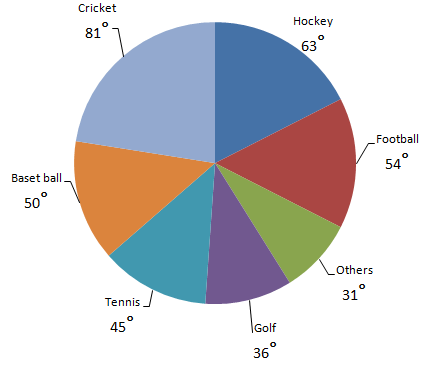
If the total amount spent on sports during the year was Rs. crores, the amount spent on Cricket and Hockey together was:
MEDIUM
IBPS Clerk Prelims
IMPORTANT
Study the following pie-chart and the table and answer the question based on them.
The proportion of the population of seven villages in

| Village | % of Population below poverty line |
| X | |
| Y | |
| Z | |
| R | |
| S | |
| T | |
| V |
MEDIUM
IBPS Clerk Prelims
IMPORTANT
Study the following pie-chart and the table and answer the question based on them.
The proportion of the population of seven villages in

| Village | % of Population below poverty line |
| X | |
| Y | |
| Z | |
| R | |
| S | |
| T | |
| V |
If the population of village R in is then what will be the population of village Y below the poverty line in that year?
EASY
IBPS Clerk Prelims
IMPORTANT
The circle-graph given here shows the spendings of a country on various sports during a particular year. Study the graph carefully and answer the question given below it.
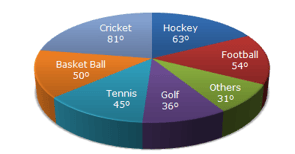
What percent of the total spendings is spent on Tennis?
MEDIUM
IBPS Clerk Prelims
IMPORTANT
Directions : The circle-graph given here shows the spendings of a country on various sports during a particular year. Study the graph carefully and answer the question given below it.

How much percent less is spent on Football than that on Cricket?
MEDIUM
IBPS Clerk Prelims
IMPORTANT
Study the following pie-chart and the table and answer the question based on them.
The proportion of the population of seven villages in

| Village | % of Population below poverty line |
| X | |
| Y | |
| Z | |
| R | |
| S | |
| T | |
| V |
Find the population of village S if the population of village X below the poverty line in is .
MEDIUM
IBPS Clerk Prelims
IMPORTANT
Study the following pie-chart and the table and answer the questions based on them.
The proportion of the population of seven villages in.

| Village | % of Population below poverty line |
| X | |
| Y | |
| Z | |
| R | |
| S | |
| T | |
| V |
If in 1998, the population of villages Y and V increase by each and the percentage of population below poverty line remains unchanged for all the villages, then find the population of village V below the poverty line in , given that the population of village Y in was


