
Study the following radar chart and answer the following question.
The given graph shows the marks of five different students .
Maximum marks
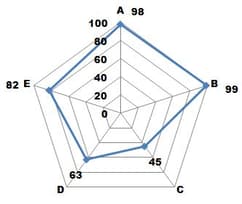
What is the percentage of marks of to that of marks of
Important Questions on Graphical Representation of Data
Read the following radar graph and answer the following question.
The given radar graph represents the income and expenditure .

Whose savings are maximum?
Directions: The following radar graph shows the number of seats won by UPA and NDA in the India General Election during .

Refer to the graphs to answer the questions that below:
What is the per cent increase in the seat won by NDA in the year with respect to the year ?Choose the incorrect statement regarding radar or web graph.
The graph is composed of two axes.
The exact values can be easily determined.
Read the following radar graph and answer the following question.
The given radar graph represents the income and expenditure .
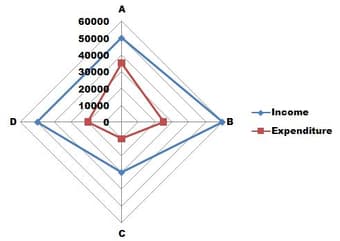
Whose savings are minimum?
Study the following radar chart and answer the following questions:
The given graph shows the number of girls and boys in different departments

What is the total number of students in departments
Directions: The following radar graph shows the number of seats won by UPA and NDA in the India General Election during .

Refer to the graphs to answer the questions that below:
In which year, the percentage of seats won by NDA is approx. of seats won by UPA?Read the following radar graph and answer the following question.
The given radar graph represents the income and expenditure .

What is the average income of
Among the given statements which of the following statement is true about the radar charts?
The data can be easily analyzed.
It is easy to compare the length of spokes.
Study the following radar chart and answer the following questions:
The given graph shows the number of girls and boys in different departments
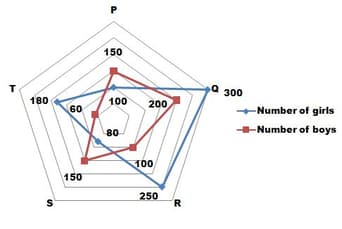
What is the average number of boys in all the departments?
In the following question, choose the correct statement regarding the radar chart.
There is an error bar in the radar chart.
Radar chart can only be plotted for more than three variables.
The radar chart is easy to understand.
Read the following radar graph and answer the following question.
The given radar graph represents the income and expenditure .

What is the savings of
Study the following radar chart and answer the following questions:
The given graph shows the number of girls and boys in different departments

Calculate the average number of girls in all departments.
Directions: The following radar graph shows the number of seats won by UPA and NDA in the India General Election during .

Refer to the graphs to answer the questions that below:
In which year, the number of seats won by UPA compare to the previous year is decreased by ?Read the following radar graph and answer the following question.
The given radar graph represents the income and expenditure .

What is the average expenditure of approximately?
Choose the correct statement regarding the radar chart.
In a radar chart, the data points can easily be labeled.
In a radar chart, the data is composed only on one axis.
Directions: The following radar graph shows the number of seats won by UPA and NDA in the India General Election during .
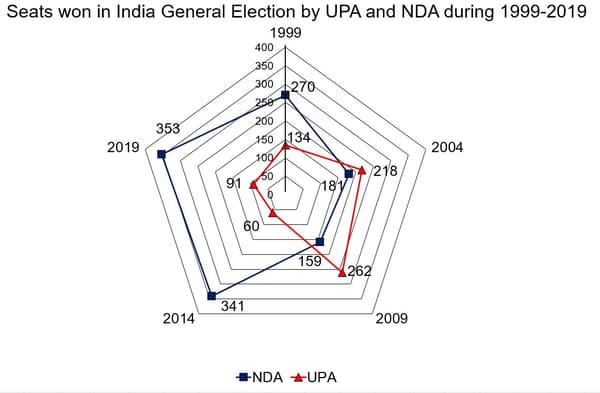
Refer to the graphs to answer the questions that below:
During which year was the percentage increase in seats won was lowest for UPA as compared to the previous year?Choose the correct statement regarding the radar chart from the statements given below:
The radar chart shows the relationship between more than two variables at once.
The radar chart do not show the relationship between more than two variables.
Directions: The following radar graph shows the number of seats won by UPA and NDA in the India General Election during .

Refer to the graphs to answer the questions that below:
During which year was the percentage increase in seats won was highest for NDA as compared to the previous year?
Study the following radar chart and answer the following question.
The given graph shows the marks of five different students .
Maximum marks

Calculate the average marks of


