
Study the given pictograph and answer the questions that follow.

. How many children were asked to choose the toppings?
Important Questions on Data Handling
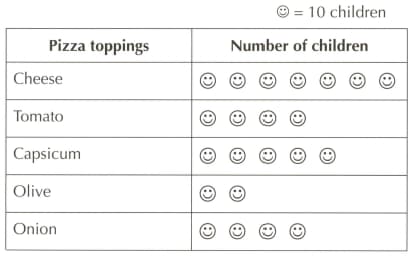
Which topping was chosen by minimum number of children?

How many children chose cheese topping?
Pictograph given below represents the sale of fruit baskets by a fruit seller in the month of December. Study the pictograph and answer the questions.
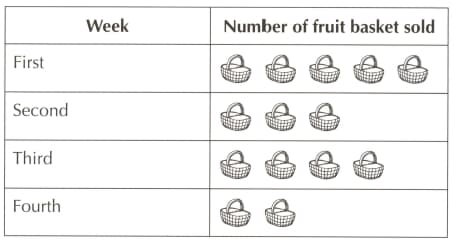
In which week was the sale maximum?
Pictograph given below represents the sale of fruits baskets by a fruit seller in the month of December. Study the pictograph and answer the questions.
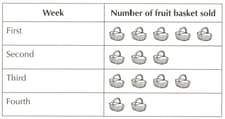
In which week was the sale is minimum?
Study the data given below and answer the question that follow:
| Favourite sport | Boys | Girls | Total no. Of students |
|---|---|---|---|
| Cricket | |||
| Football | |||
| Tennis | |||
| Badminton | - | ||
Which is the most and the least popular game?
Study the data given below and answer the question that follow:
|
Favourite sport |
Boys | Girls | Total no. of students |
|---|---|---|---|
| Cricket | |||
| Football | |||
| Tennis | |||
| Badminton | - | ||
Which sport is liked more by boys – cricket or football?
Study the data given below and answer the question that follow:
| Favourite sport | Boys | Girls | Total no. of students |
|---|---|---|---|
| Cricket | |||
| Football | |||
| Tennis | |||
| Badminton | - | ||
How many more boys liked cricket than tennis?
The following table shows the average daily temperature for a week. Study the table carefully and answer the question that follow:
Name the hottest and the coldest day?


