
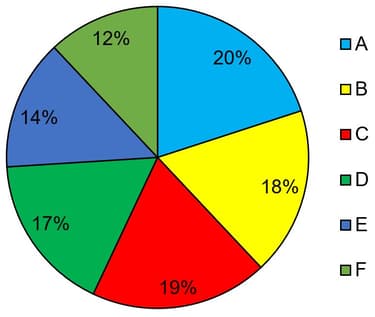
Study the given pie chart and table and answer the question that follows.
The pie chart represents the percentage wise distribution of students of class is a school in six different sections A, B, C, D, E, and F.
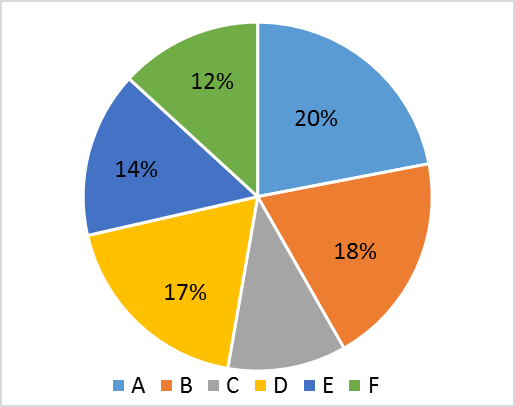 .
.
The table shows the number of boys of class X in six different sections A, B, C, D, E, and F.
Section
A
B
C
D
E
F
No. of boys
If the total number of students in section C is , then the total number of girls in section C and D together will be:
.Important Questions on Graphical Representation of Data
The following pie-chart and table show the percentage distribution of farmers in 5 states A, B, C, D & E of a country who claimed insurance due to drought in the year 2017 and ratio of males to females of the number of farmers in states, respectively.
Study the pie-chart and the table carefully and answer the following questions.
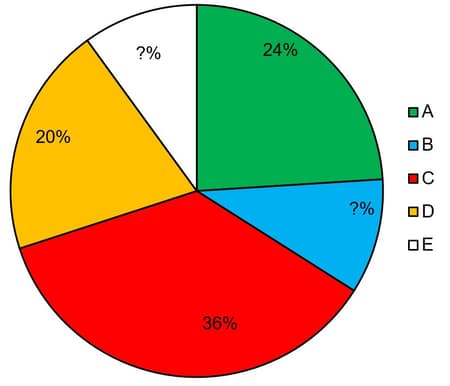
| State | Male : Female |
| A | 5 : 3 |
| B | 4 : 1 |
| C | - : - |
| D | 5 : - |
| E | 3 : 2 |
Note: Some data are missing in the pie-chart and table, if required in any question, find the missing data first and then answer the question Total number of farmers who claimed insurance in the year 2017 = 2,64,000
The number of farmers who claimed insurance in state C exceeds the total number of farmers (who claimed insurance) in state E and state A together by 5280. What is the percentage of farmers who claimed insurance in state E?
The following pie chart represents the percentage-wise distribution of students of class X in a school in six different sections A, B, C, D, E and F.

The given table shows the number of boys of class X in six different sections A, B, C, D, E and E.
| Section | A | B | C | D | E | F |
| No. of boys | ___ |
The total number of boys in sections A, B and D together is what pecentage more than the total number of girls in section A, B and D together?
The following Pie chart represents the percentage- wise distribution of students of class XII in a school in six different sections A, B, C, D, E and F.
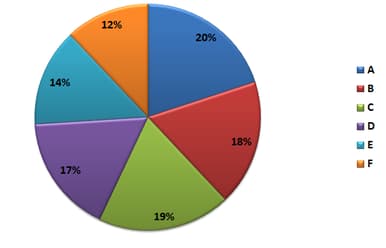
The table given below shows the number of girls of class XII in six different sections A, B, C, D, E and F.
| Section | A | B | C | D | E | F |
| Number of girls |
The total number of girls in sections B, C and D together is what percentage more than the total number of boys in sections A, B and D together?
The given pie chart represents the percentage-wise distribution of students of class X in a school in six different sections A, B, C, D, E and F.
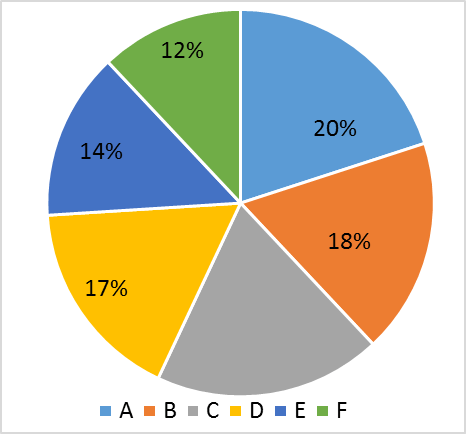 .
.
The given table shows the number of boys of class X in six different sections A, B, C, D, E and F.
| Sections | A | B | C | D | E | F |
| No. of boys |
If in section E, the ratio of boys and girls is , then the ratio of the number of girls in section B to that of the number of girls in section E is:
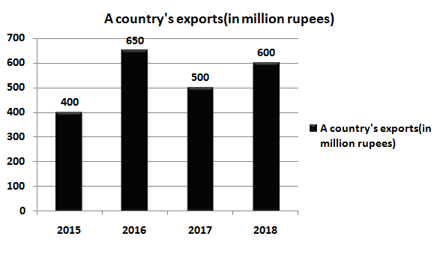
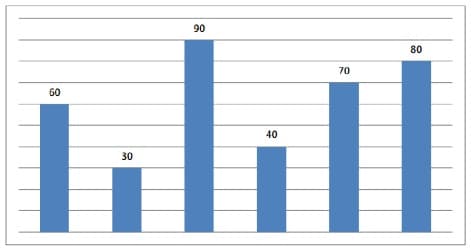
The given bar graph presents a country's exports (in million rupees) during , and the table that follows shows the break-up of goods exported in a year.

Break-Up of Goods Exported in a year
| Computers | |
| Garments | |
| Textiles | |
| Cosmetics | |
| Jewellery |
Total exports of Jewellery in and is what percent of the total exports of textiles in and ?
The given bar graph presents a country's exports (in million rupees) during , and the table that follows shows the break-up of goods exported in a year.
Break-Up of Goods Exported in a year
| Computers | |
| Garments | |
| Textiles | |
| Cosmetics | |
| Jewellery |
What is the ratio of the total exports of Computers in and to the total exports of Cosmetics in and ?
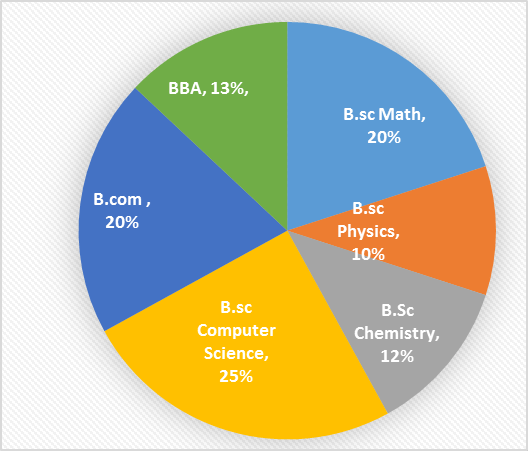
Study the given pie chart and answer the question that follows.
Total number of students admitted in a college
Distribution of the percentage of students in various courses.
 .
.
Percentage-wise distribution of the number of boys.
| Course | Number of boys |
| B.sc Math | |
| B.sc Physics | |
| B.sc Computer Science | |
| B.com | |
| B.sc Chemistry | |
| BBA |
The difference between the number of boys and the number of girls admitted in B.Com. is:
Study the given pie chart and answer the question that follows.
Total number of students admitted in a college
Distribution of the percentage of students in various couses.
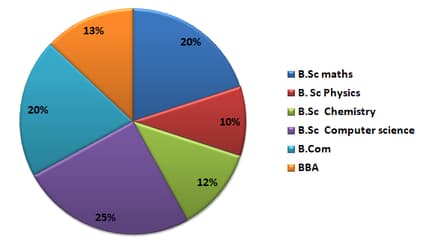
Percentage-wise distribution of the number of boys.
| Course | Number of boys |
| B.Sc. Maths | |
| B.Sc. Physics | |
| B.Sc. Chemistry | |
| B.Sc. Computer science | |
| B.Com | |
| BBA |
The ratio of the total number of girls admitted in B.Sc maths to the total number of students admitted in B.Sc maths is_____.
The following Pie chart represents the percentage-wise distribution of students of class in a school in six different sections and .
The table given below shows the number of boys of class in six different sections and .
| Section | ||||||
| Number of boys |
If in section , the ratio of the number of boys to the number of girls is , then find the ratio of the number of boys in section to the number of girls in section .
The given bar graph presents a country's exports (in million rupees) during , and the table that follows shows the break-up of goods exported in a year.

Break-Up of Goods Exported in a year
| Computers | |
| Garments | |
| Textiles | |
| Cosmetics | |
| Jewellery |
Total exports of cosmetics in four years is approx. what percent less than the total exports of Garments and Jewellery in and ?
The line graph shows electricity consumption (in ) for three households A, B and C for months February to May.
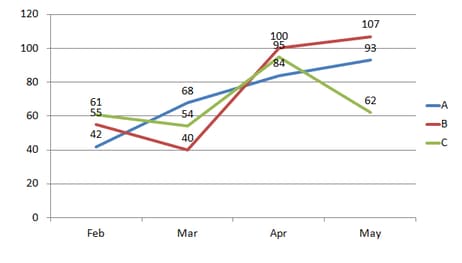
If the per- rate chart is:
| Rate per (₹) | |
| First | |
| Next | |
| Above |
In the given line graph, the electric charges collected from all (A, B and C) for the month of February is:
Study the graph carefully and answer the questions that follow.
Break-up of employees working in various departments of an organisation and the ratio of number of men to number of women.
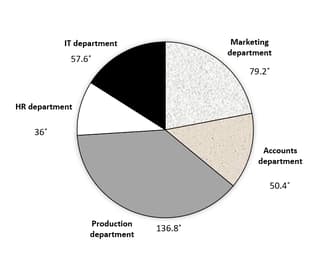
TOTAL NUMBER OF EMPLOYEES
RESPECTIVE RATIO OF NUMBER OF MEN TO NUMBER OF WOMEN IN EACH DEPARTMENT.
| Department | Men | women |
| Production | ||
| HR | ||
| IT | ||
| marketing | ||
| Accounts |
What is the total number of men working in the organisation?
The table given below shows the no. of units produced of six different items by a company, the mark-up % on each unit and the discount offered on the marked-up price of each unit.
The cost price of all the items is same and fixed at Rs 100. The line graph shows the estimated percentage of items sold by the company on the normal discounted price.
The bar graph shows the percentage of cost price at which the company sold the remaining no. of items.( means the company sold the remaining no. of items at a price lower than the cost price)
| A | B | C | D | E | F | |
| Production Unit | 200 | 160 | 80 | 140 | 180 | 150 |
| Mark Up % | 50 | 60 | 80 | 40 | 60 | 45 |
| Discount % | 20 | 25 | 40 | 15 | 20 | 20 |
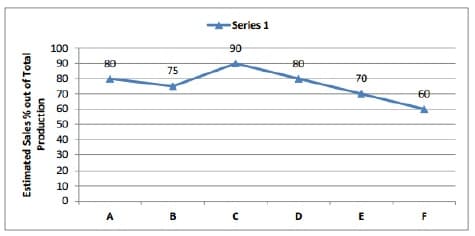
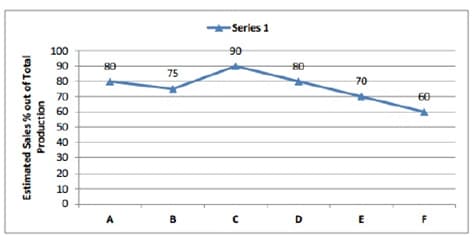
In year 2016, E has increased his discount by basis point and which lead to increase in its estimated sales by basis point. Apart from that everything else remains same then what is the difference in profit in year 2015 to 2016.
Find the population of village C if the population of village F below poverty line in 2015 is 12160.
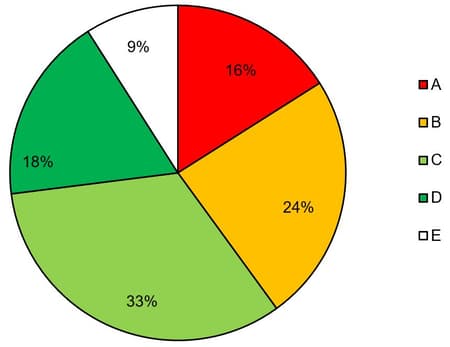
Study the graphs carefully and answer the questions that follow.
Total number of children in different schools and the percentage of girls in them Number of Children
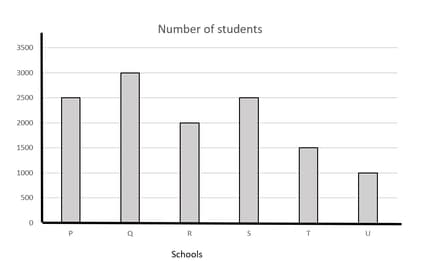
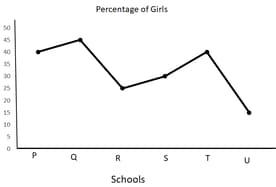
What is the average number of boys in schools P and Q together?
Study the following graph carefully and answer the question:
The below bar graph shows the percentage of males and females in the five organisations,
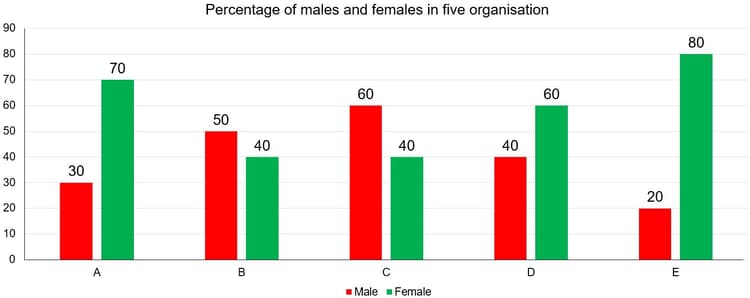
The total number of employee
The below pie chart shows the percentage of employees in the five organisations,
What is the total number of females in organisation A and C together?
Study the graphs carefully and answer the questions that follow.
Total number of children in different schools and the percentage of girls in them Number of Children
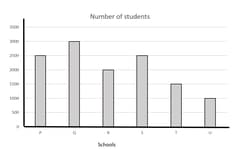
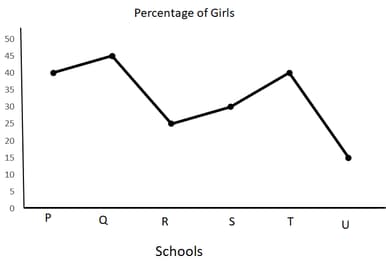
What is the total percentage of boys in schools R and U together? (rounded off to two digits after decimal)


