
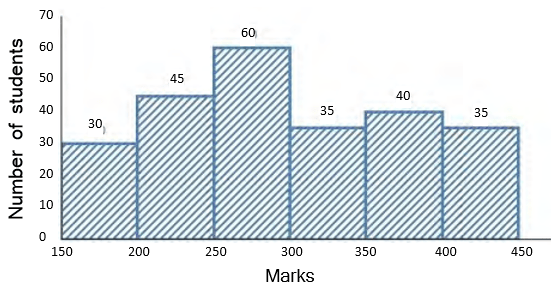
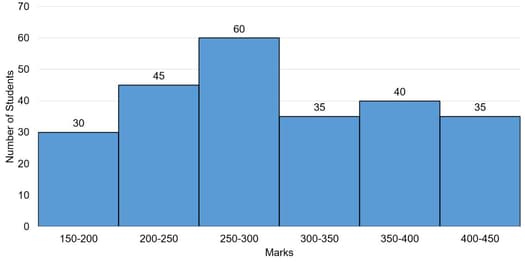
Study the histogram showing the marks obtained by students in an examination and then answer the given question.
 .
.
The number of students who got marks between and is what percent more than the number of students who got or more marks?
.Important Questions on Graphical Representation of Data
The given histogram shows the frequency distribution of the speed of cars passing through a particular spot on a highway. Read the graph and answer the following question.
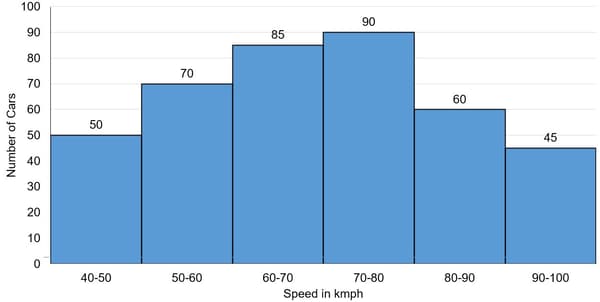
What percentage of cars were running with the speed of and above?
Study the given histogram that shows the marks obtained by students in an examination and answer the question that follows,
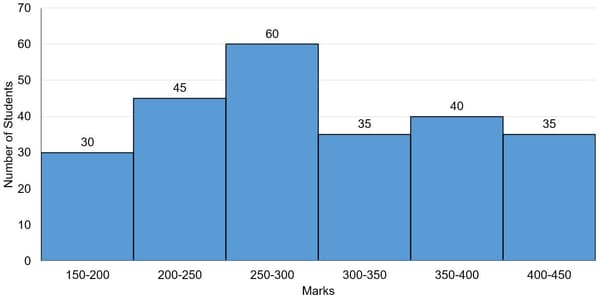
The number of students who obtained less than marks is:
The given histogram shows the frequency distribution of the speed of cars passing through a particular spot on a highway. Read the graph and answer the following question.

What is the ratio of the number of cars with speed less than to the number of cars with speed more than ?
The following histogram represents the distribution of household expenditure (in ) of manual workers in a city.
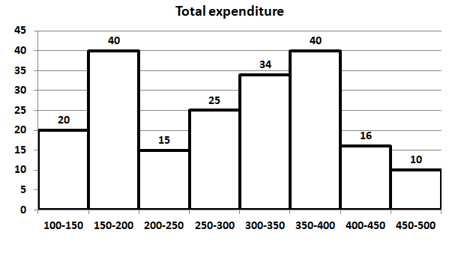
The ratio of the number of workers whose household expenditure is less than to the number of workers whose household expenditure is less than is _____.
The given graph shows the marks obtained by the students in an examination.

The numbers of students who obtained less than marks is what percent more than the number of students who obtained or more marks?
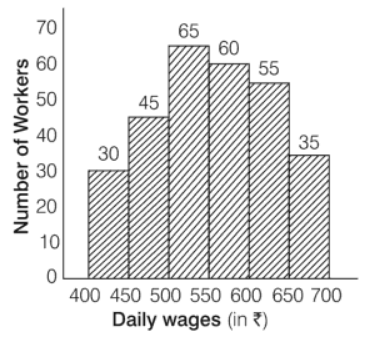
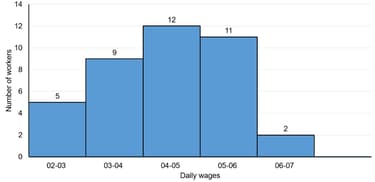
Study the given graph which shows the number of workers with their wages and answer the question that follows:
 .
.
What is the ratio of the total number of worker whose daily wages are or above but less than to the total number of workers whose daily wages are or above?
The given histogram shows the frequency distribution of the speed of cars passing through at a particular spot on a highway. Study the graph and answer the questions that follows:
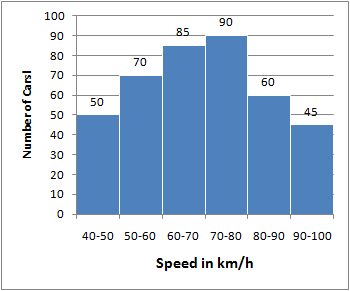
What percentage of cars were running with a speed of less than ?
The histogram shows the marks scored by students in a test with maximum marks.
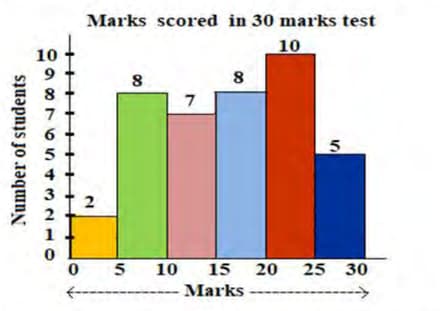
What is the percentage of the students who scored less than marks?
Study the graph and answer the question,
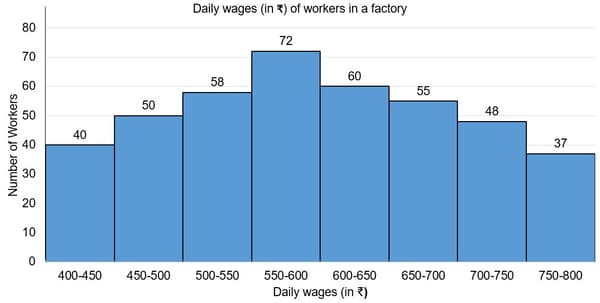
The number of workers in the factory whose daily wages are or more but less than is:
Study the given histogram that shows the marks obtained by students in an examination and answer the question that follows.

If the total marks obtained by students be represented as a pie chart, then the central angle corresponding to marks or more but less than , is _____. (Correct to the nearest degree)
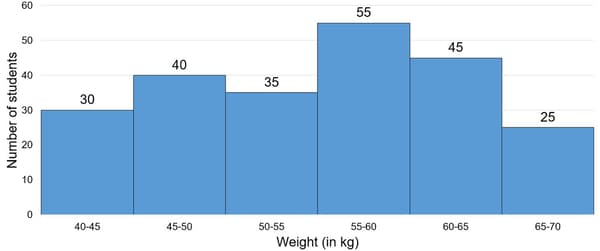
The histogram shows the weights of students of class in a school.
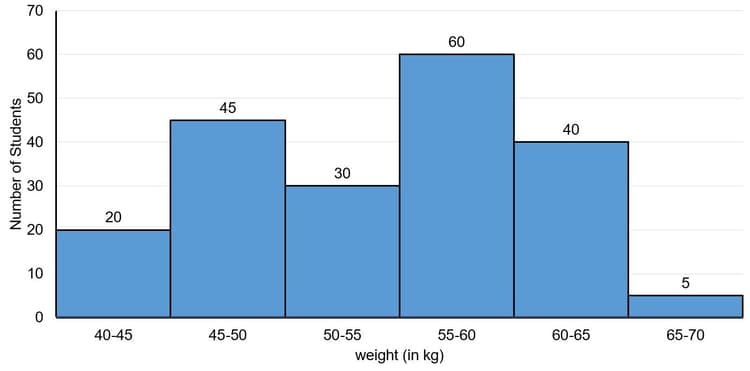
Let be the number of students whose weight is less than and be the number of the students whose weight is greater than or equal to . What is the value of ?
Study the given histogram that shows the marks obtained by students in an examination and answer the question that follows.

The number of students who obtained less than marks is what per cent more than the number of students who obtained or more marks? (Correct to one decimal place)
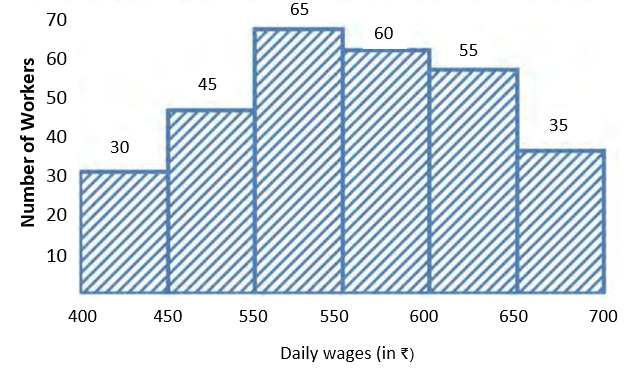
In a factory, there are workers who have been categorised into five groups () on the basis of the range of their daily wages (in multiples of ). It is ensured that the daily wage of no worker is an exact multiple of . The distribution is presented through the given histogram.
If two Managers are engaged to supervise the workers, with daily wages ranging between and , then what will be the average daily wage (nearest to an ) of all members of staff of the factory?
Study the graph and answer the question.
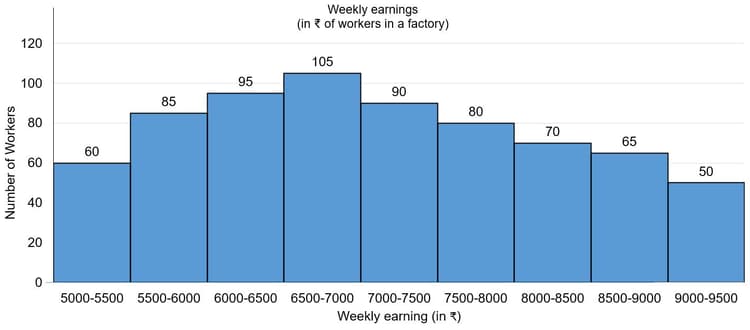
The number of workers in the factory whose weekly earning are or more but less than is:
Study the graph which shows the daily wages with number of workers and answer the question that follows.
 .
.
If the ratio of the total number of workers whose daily wages are less than to the total number of workers whose daily wages are or above is , then what is the difference between and .
The histogram shows the marks scored by students in a test with maximum marks.

What is the percentage of the students who scored less than marks?
Some persons went on an outstation tour. The histogram shows their ages:
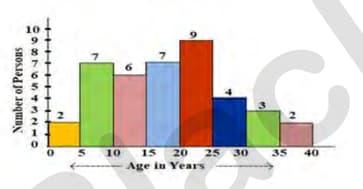
How many persons are less than of age?
Study the given histogram that shows the marks obtained by students in an examination and answer the question that follows.

The number of students who obtained less than marks is what per cent more than the number of students who obtained or more marks? (correct to one decimal place)
The given graph shows the weights of students in a school on a particular day.
The number of students weighing less than is what percent less than the number of students weighing or more?
Study the given histogram that shows the marks obtained by students in an examination and answer the question that follows.
If the total marks obtained by students be represented as a pie chart, then the central angle of the sector representing marks or more but less than , is _____. (Correct to the nearest degree)


