
Table shows the results of an experiment to measure the resistance of a carbon resistor whose resistance is given by the manufacturer as .
Potential difference/ V
Current / A
2.1
0.040
4.0
0.079
6.3
.0128
7.9
0.192
10.0
0.202
12.1
0.250
Plot a graph to show the Characteristic of this resistor.
Important Questions on Resistance and Resistivity
Table shows the results of an experiment to measure the resistance of a carbon resistor whose resistance is given by the manufacturer as
.
| Potential difference/ V | Current / A |
| 2.1 | 0.040 |
| 4.0 | 0.079 |
| 6.3 | .0128 |
| 7.9 | 0.192 |
| 10.0 | 0.202 |
| 12.1 | 0.250 |
Do the points appear to fall on a straight line that passes through the origin of the graph?
Table shows the results of an experiment to measure the resistance of a carbon resistor whose resistance is given by the manufacturer as .
| Potential difference/ V | Current / A |
| 2.1 | 0.040 |
| 4.0 | 0.079 |
| 6.3 | .0128 |
| 7.9 | 0.192 |
| 10.0 | 0.202 |
| 12.1 | 0.250 |
Use the graph to determine the resistance of the resistor.
Table shows the results of an experiment to measure the resistance of a carbon resistor whose resistance is given by the manufacturer as .
| Potential difference/ V | Current / A |
| 2.1 | 0.040 |
| 4.0 | 0.079 |
| 6.3 | .0128 |
| 7.9 | 0.192 |
| 10.0 | 0.202 |
| 12.1 | 0.250 |
Does the value of the resistance fall within the range given by the manufacturer?
An electrical component allows a current of through it when a voltage of is applied. When the voltage is increased to , the current becomes . Does the component obey Ohm’s law? Give numerical values for the resistance to justify your answer.
The two graphs in Figure show the characteristics of a metal wire at two different temperatures, .
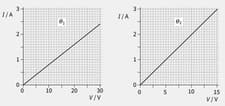
Calculate the resistance of the wire at each temperature.
The two graphs in Figure show the characteristics of a metal wire at two different temperatures, .

State which is the higher temperature, .
The graph in Figure 10.6 shows characteristics of two electrical components, a filament lamp and a length of steel wire.
Identify which curve relates to each component.
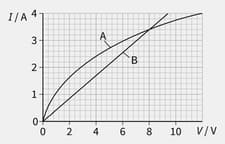
The graph in Figure shows characteristics of two electrical components, a filament lamp and a length of steel wire.
State the voltage at which both have the same resistance.


