
Thamarai is fond of reading books. The number of pages read by her on each day during the last days are given below. Make a Tally Marks table.
Important Questions on Statistics
The following table shows the number of vehicles sold in a year.

Look at the pictograph and answer the following question.
How many motorcycles were sold in a year?
The following table shows the number of vehicles sold in a year.
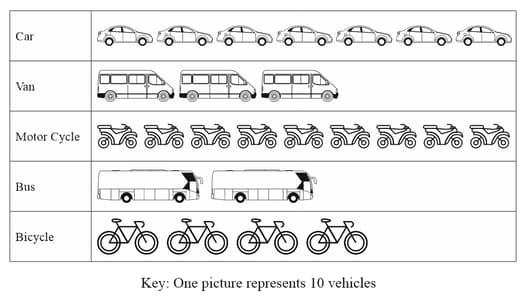
Look at the pictograph and answer the following question.
Number of buses sold in a year is . Say True or False.
The following table shows the number of vehicles sold in a year.

Look at the pictograph and answer the following question.
How many bicycles were sold?
The following table shows the number of vehicles sold in a year.

Look at the pictograph and answer the following questions.
How many cars and vans were sold?
The following table shows the number of vehicles sold in a year.

Look at the pictograph and answer the following question.
How many vehicles were sold altogether?
The pictograph shows the number of branded mobile phones sold in five months.
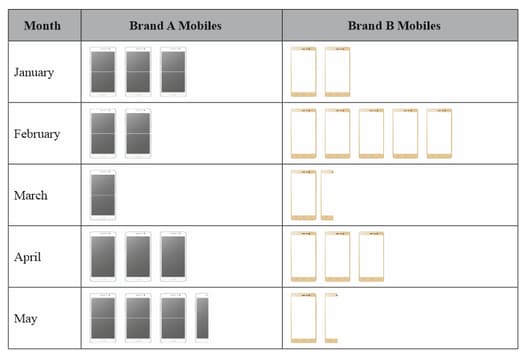
Each picture of  represents mobiles each
  represents mobiles
Observe the given table and answer the following questions.
In which month was the maximum number of brand mobiles sold?
The pictograph shows the number of branded mobile phones sold in five months.
Each picture of represents mobiles each represents mobiles
Observe the given table and answer the following questions.
In which month was an equal number of brand and brand mobiles sold?
The pictograph shows the number of branded mobile phones sold in five months.
Each picture of represents mobiles each  represents mobiles
Observe the given table and answer the following questions.
In which month was the minimum number of brand mobiles sold?


