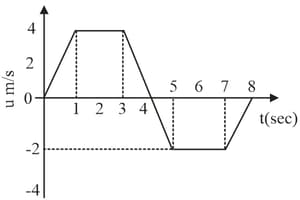
The adjoining curve represents the velocity–time graph of a particle, its acceleration values along and in are, respectively.
Important Questions on Kinematics
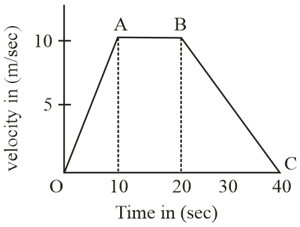
The velocity–time graph of a linear motion is shown below. The displacement from the origin after is,
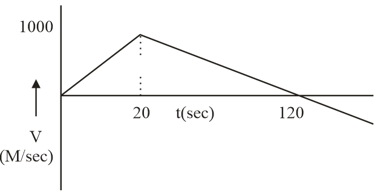
A rocket is projected vertically upwards and its time velocity graph is shown in the figure. The maximum height attained by the rocket is
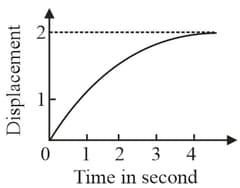
The displacement of a particle as a function of time is shown in the figure. The figure indicates that
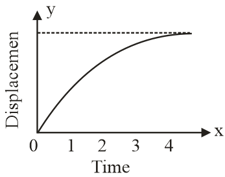
Figure shows position-time graph of two cars and
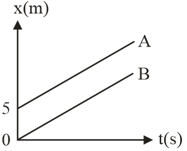
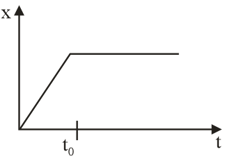
Figure shows the displacement time graph of a particle moving on the -axis.
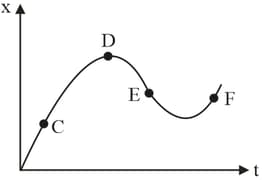
The displacement–time graph of a moving particle is shown below. The instantaneous velocity of the particle is negative at the point:
The displacement of a particle as a function of time is shown in the figure. The figure shows that
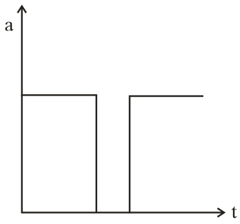
Acceleration–time graph of a body is shown. The corresponding velocity–time graph of the same body is