
The angular amplitude of a pendulum is measured as .
The protractor used in this measurement was calibrated in degrees. Suggest why the user only feels confident to give the reading to within .
Important Questions on Practical Skills at AS Level
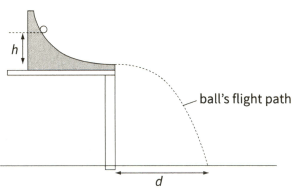
A ball is allowed to roll down a ramp from different starting points. Figure shows the apparatus used. The ramp is placed at a fixed height above the floor. You are asked to measure the vertical height h of the starting point above the bottom of the ramp and the horizontal distance d the ball travels after it leaves the ramp.
 \
\
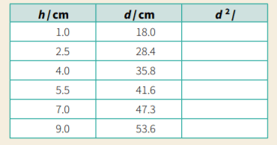
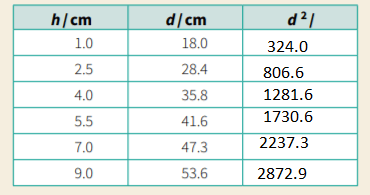
Also find the square of the horizontal distance the ball travels after it leaves the ramp. Table shows the raw results for the experiment. C0mplete the table.
Use your results from this table
to plot a graph of the square of the horizontal distance (on the -axis) against the height (on the -axis). Draw the best fit line.
Determine the gradient of the line on this graph
h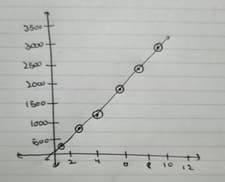
d2
and the intercept with the -axis. Remember, both the gradient and the intercept have units; these should be included in your answer.
A student obtains the following data for two variables and .
| T / s | m / kg |
| 4.6 | 0.90 |
| 6.3 | 1.20 |
The first value of $T$ has an uncertainty of . Do the results show that is proportional to ?
A student obtains the following values of two variables and .
| r / cm | t / s |
| 6.2 | 4.6 |
| 12.0 | 6.0 |
The first value of has an uncertainty of , which is much greater than the percentage uncertainty in . Do the results show that is proportional to ?
You measure the following quantities:
Calculate the result and its uncertainty for each of the following expressions. You may express your uncertainty either as an absolute value or as a percentage.
(a)
You measure the following quantities:
Calculate the result and its uncertainty for each of the following expressions. You may express your uncertainty either as an absolute value or as a percentage.
(b)


