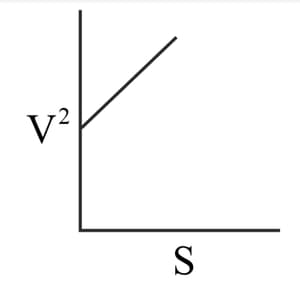
The area under speed-time graph represents a physical quantity which has the unit of?
Important Questions on Kinematics
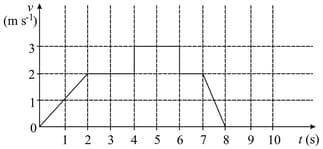
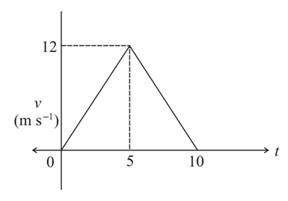
A particle starts from the origin at time and moves along the positive axis. The graph of velocity with respect to time is shown in figure. What is the position of the particle at time
The displacement-time graph of a body in motion is given as below:
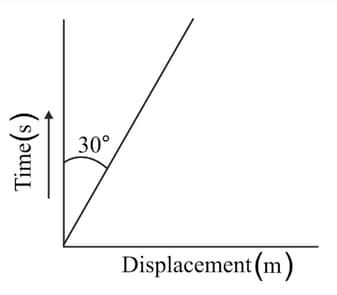
Velocity of body is ( ) :
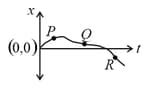
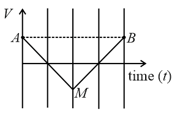
The position-time graphs for two students and returning from the school to their homes are shown in figure.
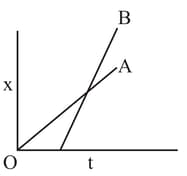
(A) lives closer to the school
(B) lives closer to the school
(C) takes lesser time to reach home
(D) travels faster than
(E) travels faster than
Choose the correct answer from the options given below
Acceleration-time graph of a body moving in a straight line is as shown in figure. The body started its motion from rest.
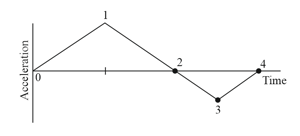
At which point is the body moving with the largest speed?
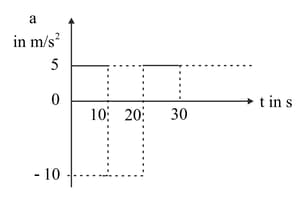
At what instant does the particle come to rest for the first time?
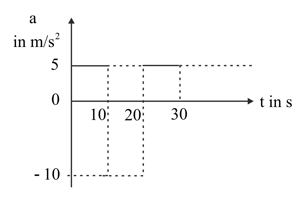
What is the total distance travelled by the particle during ?
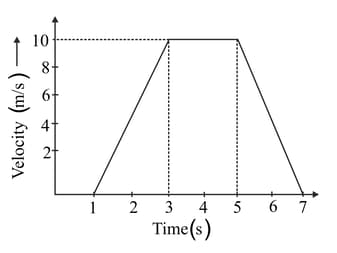
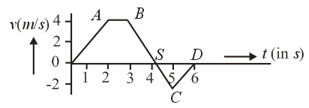
The velocity and time graph of a body in a straight line motion is shown in the figure. The point is at seconds. The total distance covered by the body in is :
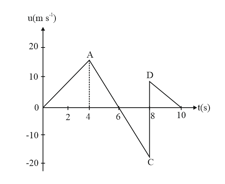
The velocity-time graph of a body moving in a straight line is shown in figure. Find the displacement and distance travelled by the body in seconds.
A body initially at rest start moving when a constant external force F is applied on it. The force F is applied for time t = 0 to time t = T. Which of the following graph represents the variation of the speed (v) of the body with time (t)
The following figure shows the speed-time graph of a particle moving along a fixed direction. The distance travelled by the particle between time to is
If the velocity-time graph has the shape what would be the shape of the corresponding acceleration-time graph?
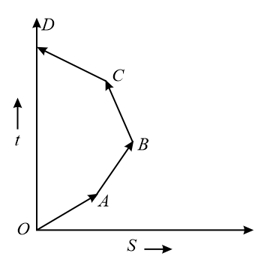
graph of the moving body in straight line is as shown in figure. Which among the following is not true?