
The bar graph given below represents the marks of a student in six different subjects. Read the following graph and answer the questions given below.

In which subject did the student score maximum and how much did he score in that subject.
Important Questions on Data Handling
The bar graph given below represents the marks of a student in six different subjects. Read the following graph and answer the questions given below.

In which subject is the student's score minimum how much did he score in that subject?
The bar graph given below represents the marks of a student in six different subjects. Read the following graph and answer the questions given below.

What are the average marks obtained by the student in best subjects according to score.
The bar graph given below represents the marks of a student in six different subjects. Read the following graph and answer the questions given below.

What is the average obtained by students in Hindi, Geography and English?
The bar graph given below represents the marks of a student in six different subjects. Read the following graph and answer the questions given below.
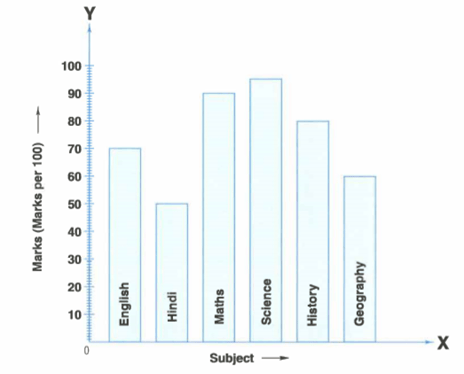
What is the ratio of the highest marks to the lowest marks obtained by the student?
The following bar graph represents the no. of students attending hobby classes in school during weeks. Read the double bar graph given here and answer the following questions.

In which hobby class the increase in strength of the students maximum from week to week ?
The following bar graph represents the no. of students attending hobby classes in school during weeks. Read the double bar graph given here and answer the following questions.

In which hobby class did the decrease in strength of the students maximum from week to week ?
The following bar graph represents the no. of students attending hobby classes in school during weeks. Read the double bar graph given here and answer the following questions.

In which hobby class was the strength of students remained same during both weeks?
The following bar graph represents the no. of students attending hobby classes in school during weeks. Read the double bar graph given here and answer the following questions.
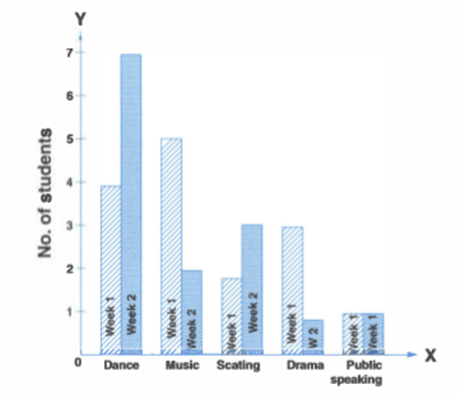
Considering both weeks together, which hobby class was attended by maximum no. of students.


