
The bar graph represents the number of pets owned by friends.
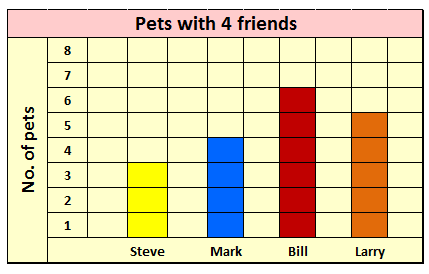
Who has double the number of pets than Steve?
Important Questions on Smart Charts
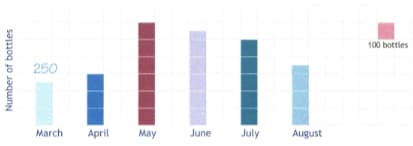
This chart shows the number of bottles of cold drinks sold by a shop in different months of a year. Write the numbers in the chart, as shown for March.
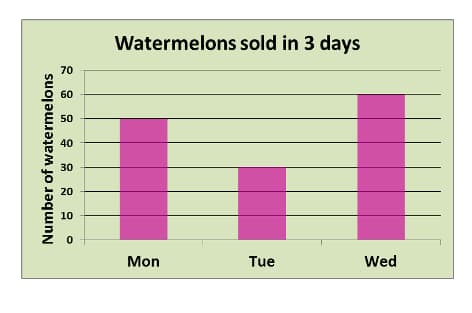
After the sale he is left with more watermelons.
To begin with he had _____ watermelons.
(Please enter only numerals)
Table shows the favourite game of students of a school.
| Games | Cricket | Football | Swimming |
| No. of Students | 60 | 30 | 10 |
Identify the bar graph which represents the table.

Look at the picture and fill in the blanks:
The length of Geeta’s hand is _____ (more/less) than Rohan’s hand.

Look at the picture and fill in the blanks:
_____ has the shortest hand.
The bar graph represents number of white and grey pigeons in different parks.
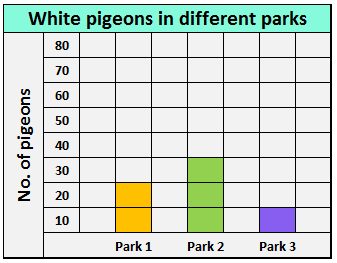
Total number of pigeons in Park _____ .
(Please enter only numerals)
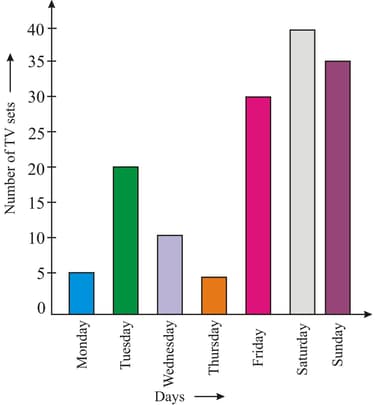
Read the above bar graph and fill in the blank:
Number of TV sets sold on Friday is =_____.
The table represents the money collected by different grades for a social cause.
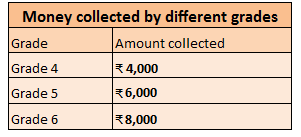
Identify the graph which represents the table.
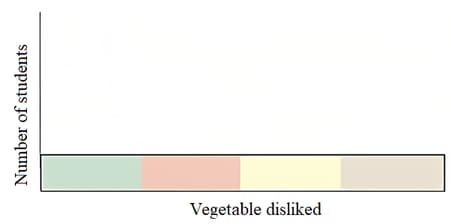
Which vegetable is most disliked? Ask your friends and complete the table.
| Vegetable disliked | Number of students |
Use this table to draw faces in the chart below. Draw  for each child on top of the vegetable disliked.
• In the month of October, he supplied oranges and got damaged.
• In the month of November, he supplied oranges and got damaged.
• In the month of December, he supplied oranges and got damaged.
Choose the graph which represents undamaged oranges supplied to the factory.
Rohan, Jacob and Geeta also measured their hands. They stuck their strips as shown.
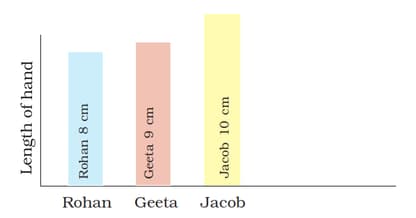
Who has the longest hand
Rohan, Jacob and Geeta also measured their hands. They stuck their strips as shown.

Look at the picture and fill in the blank:
The length of Jacob’s hand is _____ (more/less) than Geeta’s hand.
The bar graph represents the different types of dresses manufactured by Mike’s factory.
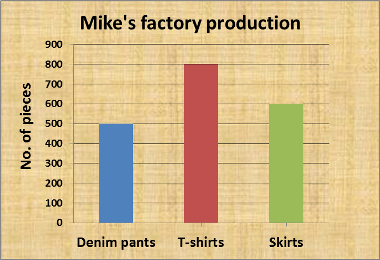
During the final stage, it was found that Denim pants, T-shirts and Skirts were damaged. Identify the table which represents the undamaged dresses for delivery.
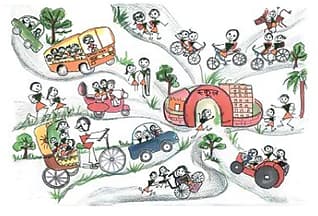
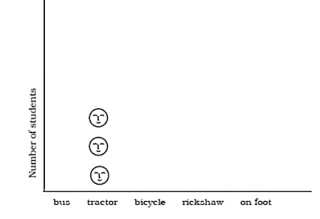
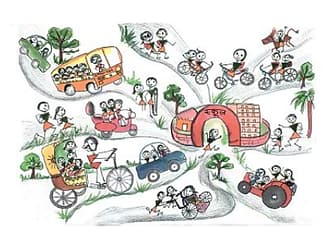
Look at the picture and fill in the table.
| Way of coming | Bus | Tractor | Bicycle | Rickshaw | on foot |
| Number of students |
Draw faces in the chart to show how many children come by bus, bicycle, rickshaw or on foot.
Mr. Nelson, a teacher in an elementary school recorded the favourite subject of his students in a bar graph. Using the bar graph and answer the following.
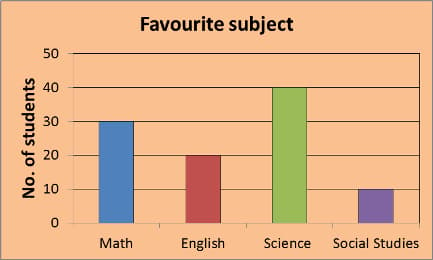
Number of students who like Science than Math _____.
(Please enter only numerals)
Identify the graph which represents the table.
The bar graph represents the different types of books for Grade kept in a school library.
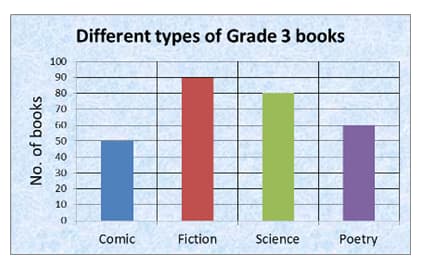
If the school decides to have as much Comic books as Science books, then how many more Comic books should to be added to the library? _____.
(Please enter only numerals)
Look at the picture and fill in the blank.
| Way of coming | Tractor | Bicycle | Walking | Car | Rikshaw |
| Number of students |
The least students come to school by _____.


