
The bar graph shown in the Figure represents the circulation of newspapers in languages. Study the bar graph and answer the following questions:
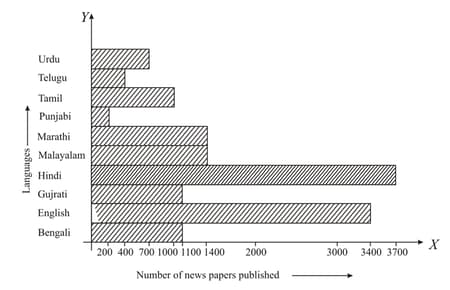
State the language in which the largest number of newspapers are published.
Important Questions on Graphical Representation of Statistical Data
The bar graph shown in the figure represents the circulation of newspapers in languages. Study the bar graph and answer the following question:
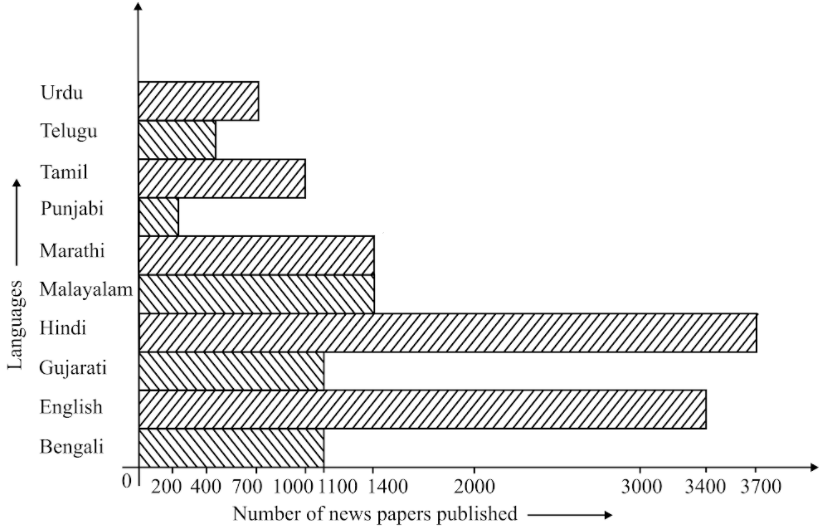
State the language in which the number of newspapers published is between and .
The bar graph shown in the figure represents the circulation of newspapers in languages. Study the bar graph and answer the following questions:
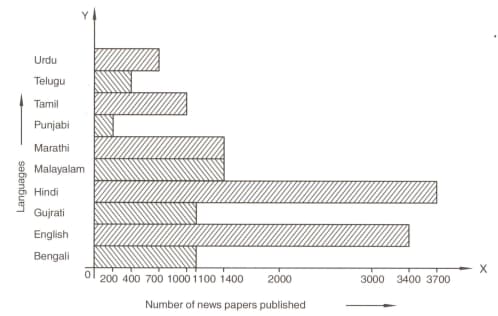
The number of newspapers published in Malayalam and Marathi together is less than those published in English.
The bar graph shown in the figure represents the circulation of newspapers in languages. Study the bar graph and answer the following questions:
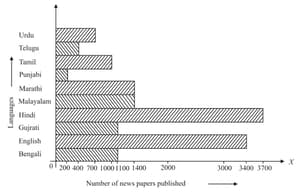
The number of newspapers published in Telugu is more than those published in Tamil.
Read the bar graph given in the figure and answer the following questions:
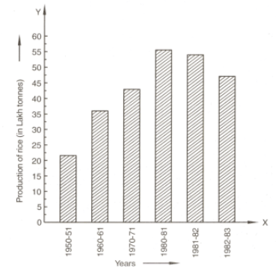
What information is given by the bar graph?
Read the bar graph given in the figure and answer the following questions:
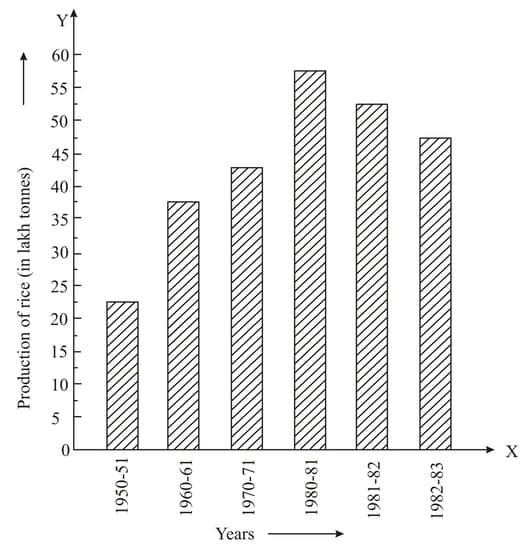
What was the crop-production of rice in?
Read the bar graph given in the figure and answer the following questions:
What is the difference between the maximum and minimum production of rice?
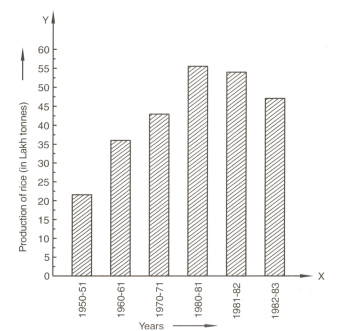
Read the bar graph.
What information does it give?
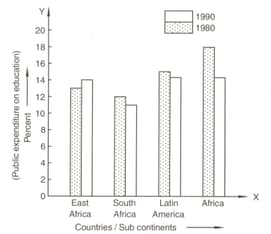
Read the bar graph given in figure and answer the following questions:
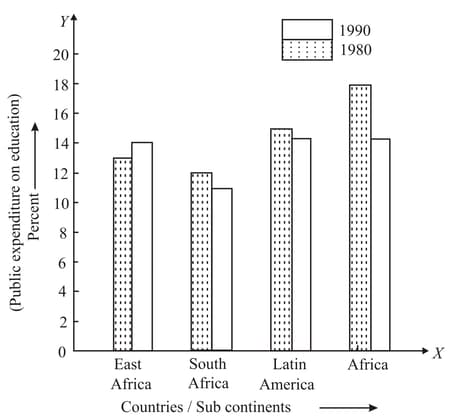
In which part the expenditure on education is maximum in ?


