
The bar graph shows the expenditure and savings of a family in a month.
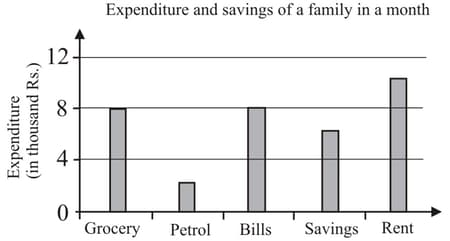
On which item did the family spend the most?
On which item did the family spend the most?
Important Questions on Data Handling

What is the monthly saving of the family?
The bar graph shows the expenditure and savings of a family in a month.
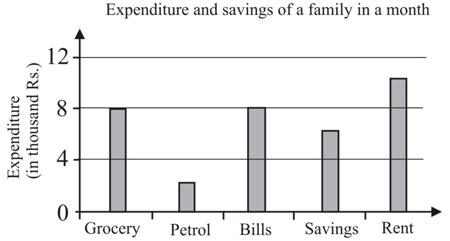
What is the monthly income of the family?
Find the ratio of the savings to the expenditure?
The table given below shows the number of fans sold by a shopkeeper from march to august. Draw a bar graph and answer the questions that follow.
| Month | No. of fans sold |
| March | 25 |
| April | 40 |
| May | 80 |
| June | 70 |
| July | 60 |
| August | 30 |
In which month was the sale most?
The table given below shows the number of fans sold by a shopkeeper from march to august. Draw a bar graph and answer the questions that follow.
| Month | No. of fans sold |
| March | 25 |
| April | 40 |
| May | 80 |
| June | 70 |
| July | 60 |
| August | 30 |
In which month was the sale most?
The table given below shows the number of fans sold by a shopkeeper from march to august. Draw a bar graph and answer the questions that follow.
| Month | No. of fans sold |
| March | 25 |
| April | 40 |
| May | 80 |
| June | 70 |
| July | 60 |
| August | 30 |
Find the ratio of the most to the least sale.
The given table shows the marks obtained by five students of class in half-yearly and annual exams in mathematics. The marks shown are out of . Represent this data in a double bar graph and answer the following questions:
| Students | Mayank | Rohit | Deepali | Soumya | Afzal |
| Marks in half-yearly exam | |||||
| Marks in annual exam |
Which student performance improved the most?
| Students | Mayank | Rohit | Deepali | Soumya | Afzal |
| Marks in half-yearly exam | 46 | 60 | 80 | 90 | 50 |
| Marks in annual exam | 70 | 80 | 70 | 90 | 60 |


