
The bar graph shows the expenditure and savings of a family in a month.

What is the monthly saving of the family?
Important Questions on Data Handling
The bar graph shows the expenditure and savings of a family in a month.
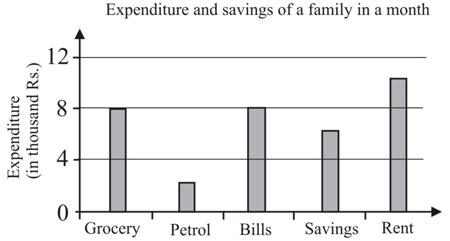
What is the monthly income of the family?
Find the ratio of the savings to the expenditure?
The table given below shows the number of fans sold by a shopkeeper from march to august. Draw a bar graph and answer the questions that follow.
| Month | No. of fans sold |
| March | 25 |
| April | 40 |
| May | 80 |
| June | 70 |
| July | 60 |
| August | 30 |
In which month was the sale most?
The table given below shows the number of fans sold by a shopkeeper from march to august. Draw a bar graph and answer the questions that follow.
| Month | No. of fans sold |
| March | 25 |
| April | 40 |
| May | 80 |
| June | 70 |
| July | 60 |
| August | 30 |
In which month was the sale most?
The table given below shows the number of fans sold by a shopkeeper from march to august. Draw a bar graph and answer the questions that follow.
| Month | No. of fans sold |
| March | 25 |
| April | 40 |
| May | 80 |
| June | 70 |
| July | 60 |
| August | 30 |
Find the ratio of the most to the least sale.
The given table shows the marks obtained by five students of class in half-yearly and annual exams in mathematics. The marks shown are out of . Represent this data in a double bar graph and answer the following questions:
| Students | Mayank | Rohit | Deepali | Soumya | Afzal |
| Marks in half-yearly exam | |||||
| Marks in annual exam |
Which student performance improved the most?
| Students | Mayank | Rohit | Deepali | Soumya | Afzal |
| Marks in half-yearly exam | 46 | 60 | 80 | 90 | 50 |
| Marks in annual exam | 70 | 80 | 70 | 90 | 60 |
The given table shows the marks obtained by five students of class 7 in half-yearly and annual exams in mathematics. The marks shown are out of 100. Represent this data in a double bar graph and answer the following questions:
| Students | Mayank | Rohit | Deepali | Soumya | Afzal |
| Marks in half-yearly exam | 46 | 60 | 80 | 90 | 50 |
| Marks in annual exam | 70 | 80 | 70 | 90 | 60 |
Who scored the least marks in annual exams?


