
MEDIUM
8th ICSE
IMPORTANT
Earn 100
The bar graph shows the preferred breakfast food for students. The number of students who prefer paranthas as a percentage of the total number of students is
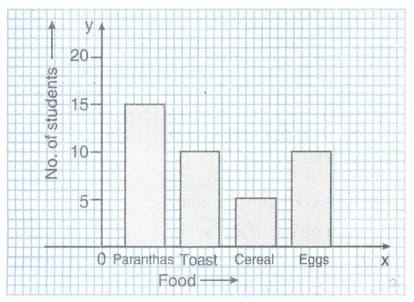
50% studentsanswered this correctly
Important Questions on Graphical Representation of Data
EASY
8th ICSE
IMPORTANT
MEDIUM
8th ICSE
IMPORTANT
Represent the following distribution of ages (in years) of teachers in a school by means of a histogram.
| Age (in years) | |||||
| Number of Teachers |
MEDIUM
8th ICSE
IMPORTANT
Draw histogram for the following frequency distribution
| Size | ||||||
| Frequency |
MEDIUM
8th ICSE
IMPORTANT
Draw a histogram for the following frequency distribution
| Size | |||||
| Frequency |
MEDIUM
8th ICSE
IMPORTANT
Draw a histogram for the following frequency distribution
| Size | |||||
| Frequency |
MEDIUM
8th ICSE
IMPORTANT
MEDIUM
8th ICSE
IMPORTANT
MEDIUM
8th ICSE
IMPORTANT
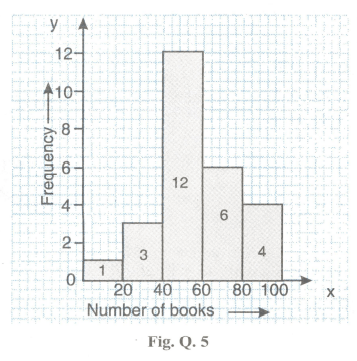
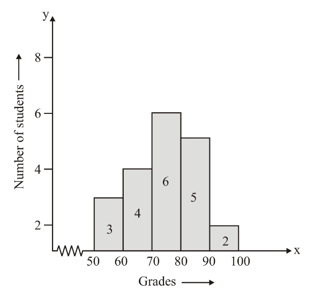
For the histogram shown alongside.
What is the total number of students over whom our study has been conducted?


