The below list shows the various ice cream flavours chosen by people in a survey.
Vanilla, Chocolate, Butterscotch, Caramel, Strawberry, Chocolate, Caramel, Vanilla, Butterscotch, Strawberry, Vanilla, Caramel, Vanilla, Butterscotch, Strawberry, Chocolate, Vanilla, Chocolate, Butterscotch, Caramel, Butterscotch, Butterscotch, Caramel, Strawberry, Caramel.
Represent the data in the following frequency distribution table and then represent the same using a pictograph, choosing a suitable key of your choice.
Flavour
Tally Marks
Frequency
Vanilla
Chocolate
Caramel
Butterscotch
Strawberry

Important Questions on Data Handling
The count of various animals in a farm is given below. Draw the bar graph for the data.
| Animals | Ducks | Sheep | Hens | Rabbits |
| Number |
Students of a college planted trees in villages of Sangli district. Make a bar graph of this data using the appropriate scale.
| Name of place | Bagni | Samdoli | Ashta | Ritu | Mega |
| Number of trees planted |
The number of customers who came to a juice centre during one week is given in the table below. Make two different bar graphs to show this data.
| Type of juice | Orange | Pineapple | Apple | Mango |
| Number of customer |
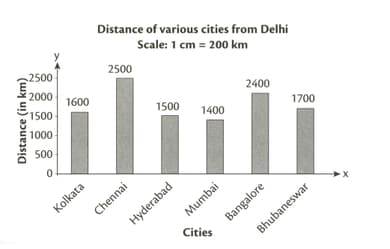
The graph shows the distance of various cities from Delhi. Find the error in the graph and also correct them. 
The information is given on the sale registered by a bookseller in year
| Fiction | ||||||||||||
| Non-Fiction |
Construct a double column graph to display the sales information.
The following table shows the annual profit of two companies(in crores) in various years. Draw the double bar graph representing the data.
| Company A | ||||||
| Company B |
The following table shows the population of two cities (in lakhs) in various years. Draw the double bar graph representing the data.
| City X | ||||||
| City Y |
From a survey, the following data shows the favourite time pass activity of men and women. Draw the double bar graph representing the data.
| Watching TV | Reading Books | Listening to music | Gardening | Crafting | |
| Men | |||||
| Women |
