
MEDIUM
Earn 100
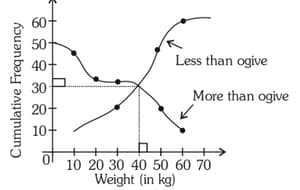
The cumulative frequency curve for distribution is represented in the graph. The median for the data is;
50% studentsanswered this correctly
Important Questions on Statistics
EASY
EASY
EASY
EASY
EASY
EASY
EASY
What is the median of the following data?
EASY
For the given data:
| Class | Frequency |
The median is _____.
EASY
EASY
EASY
What is the median of the following list of numbers?
and
EASY
EASY
Consider the following frequency distribution:
| Frequency | Cumulative Frequency | |
What are the values of Respectively?
EASY
Consider the following frequency distribution:
What is the median of the distribution?
EASY
EASY
MEDIUM
EASY
The below graph shows the number of students Vs. Marks of students:
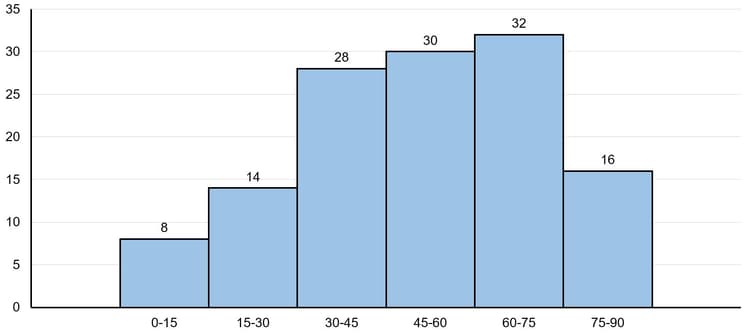
In the given histogram, in which class interval, the median marks lies:
EASY
The following is the price of Cabbage over 12 months. What is the median price?


