
The data of the sold mobile phones of different companies of a shop in October is as follows:
Name of Company
Number of sold Sets
Company A
Company B
Company C
Company D
Company E


Draw the Bar Graph for the above data.
Important Questions on Smart Charts
Study the given histogram that shows the marks obtained by students in an examination and answer the question that follows:
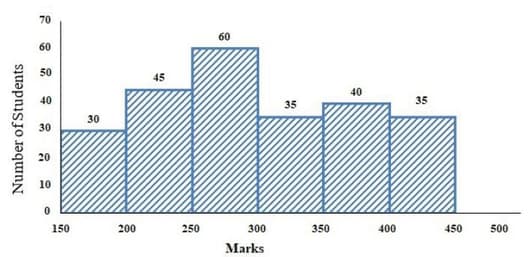
The number of students who obtained less than marks is _____.
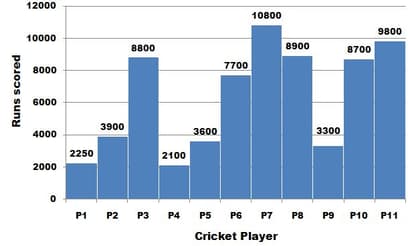
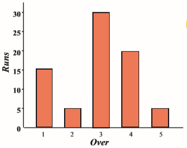
The Bar graph below presents the runs scored by eleven cricketers, named in their respective careers which lasted for five years in each case. Which cricketer bridges the gap between the highest and the lowest scorers of runs?
Sumita stood on the road for half an hour and counted the number of vehicles passing by. She made a tally mark for each vehicle. This helped her in counting quickly the total number of vehicles in each group.
Note:

Make tally marks for more buses, and more trucks.
The picture below shows the runs scored by the Indian cricket team in the first 5 overs of a match.

What are the total runs scored in the first three overs?
The following table shows the average daily temperature for a week. Study the table carefully and answer the question that follow:
On which day the temperature is exactly more than the previous day?
Yamini did a project ‘Animals and Birds’. She asked each child of her class about one favourite pet animal.
She used tally marks to record each answer. For example if someone said ‘cat’ she put one line  in front of ‘cats’. When someone said ‘cat’ again, she added a line. So
  means two cats and
  means cats. In all children said ‘cat’ was their favourite animal. Help Yamini complete the table.
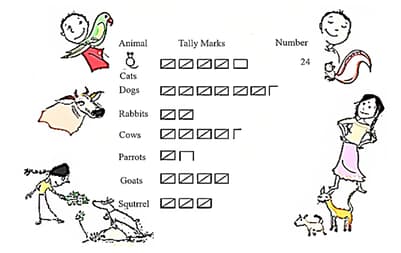
Look at the tally marks and write the number for each animal in the table. How many children did Yamini talk to?
The enrolment of children in the class of a school in five years is given in the bar graph below.
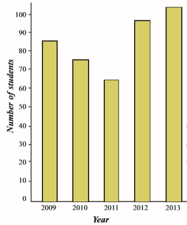
In which year did the enrolment is least? How many less than the previous year?
Sumita stood on the road for half an hour and counted the number of vehicles passing by. She made a tally mark for each vehicle. This helped her in counting quickly the total number of vehicles in each group. Write the number of each vehicle in the table.
Note:


Mr. Garg, Mr. Singh, Ms. Dubey and Ms. Neelam are four teachers in a school teaching classes to . Mr. Garg can teach English and Science only. Mr. Singh can teach Mathematics and Science only. Ms. Neelam cannot teach Hindi. Ms. Dubey teaches only one subject and there is a teacher for all the subjects mentioned in the table below.
| Subjects | Mr. Garg | Mr. Singh | Ms. Dubey | Ms. Neelam |
| English | ||||
| Hindi | ||||
| Mathematics | ||||
| Science |
Which subject can be taught by the maximum number of teachers?
The following table shows the average daily temperature for a week. Study the table carefully and answer the question that follow:
Name the hottest and the coldest day?The enrolment of children in the class of a school in five years is given in the bar graph below.

In which year did the most number of children join?
The bar diagram below shows information collected on TV viewing.
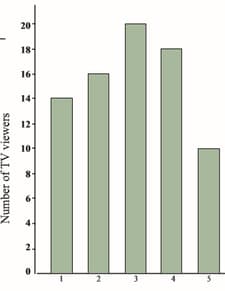
How many spend hours watching TV?
Yamini did a project 'Animals and Birds'. She asked each child of her class about one favourite pet animal.
She used tally marks to record each answer. For example if someone said 'cat' she put one line $l$ in front of 'cats'. When someone said 'cat' again, she added a line. So  means two cats and
  means cats. In all children said 'cat' was their favourite animal. Help Yamini complete the table.
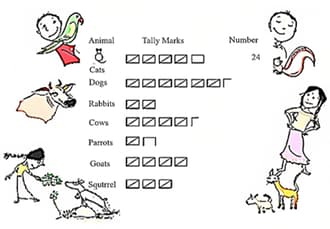
Which is the most favourite pet animal in this table?
The enrolment of children in the class of a school in five years is given in the bar graph below.

In which the enrolment is more, or ? How many more?
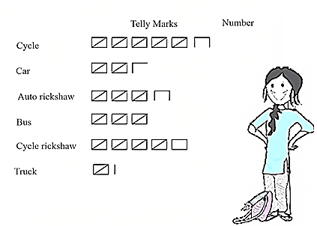
Sumita stood on the road for half an hour and counted the number of vehicles passing by. She made a tally mark for each vehicle. This helped her in counting quickly the total number of vehicles in each group.
| Tally marks | |
| Cycle |  |
| Car |  |
| Auto rickshaw |  |
| Bus |  |
| Cycle rickshaw | 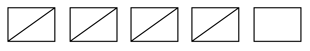 |
| Truck |  |
State True or False: Auto rickshaws are thrice the number of trucks.
The picture below shows the runs scored by the Indian cricket team in the first overs of a match.
In which over did the team score the most runs?
The bar diagram below shows information collected on TV viewing.
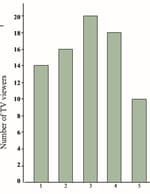
How many people watch TV for exactly one hour?
The following table shows the average daily temperature for a week. Study the table carefully and answer the question that follow:
Which day was warmer – Tuesday or Friday?
The table given below shows the number of students who applied and got admission in various courses in the university.
| Courses | Number of students who applied | Number of students who got admission |
|
English Honours |
||
|
Mathematics Honours |
||
|
Economics Honours |
||
|
Physics Honours |
||
|
B.Com. Honours |
Which course has the maximum number of seats?


