
The densities, , of chemical compounds are given in the following table.
Density
No. compounds
Find the frequencies and given in the table below.
Density
No. compounds
Important Questions on Representation of Data
The daily journey times for bank staff to get to work are given in the following table.
| Time | |||||||
| No. staff |
How many staff take between and minutes to get to work?
The daily journey times for bank staff to get to work are given in the following table.
| Time | |||||||
| No. staff |
Find the exact number of staff who take minutes or more to get to work, given that of the staff take less than minutes and that of the staff take minutes or more.
A fashion company selected , -year-old boys and , -year-old girls to audition as models. The heights, , of the selected children are represented in the following graph.

What features of the data suggest that the children were not selected at random?
A fashion company selected -year-old boys and -year-old girls to audition as models. The heights, , of the selected children are represented in the following graph.

Estimate the number of girls who are taller than the shortest boys.
A fashion company selected -year-old boys and -year-old girls to audition as models. The heights, , of the selected children are represented in the following graph.
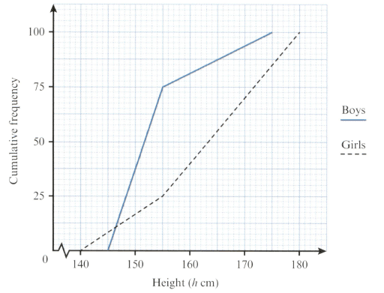
What is the significance of the value of where the graphs intersect?
A fashion company selected -year-old boys and -year-old girls to audition as models. The heights, , of the selected children are represented in the following graph.

The shortest boys and tallest girls were recalled for a second audition. On a cumulative frequency graph, show the heights of the children who were not recalled.
The following table shows the ages of the students currently at a university, given by percentage. Ages are rounded down to the number of whole years.
| Age (years) | |||||||
| Students |
Represent the data in a percentage cumulative frequency polygon.
The following table shows the ages of the students currently at a university, given by percentage. Ages are rounded down to the number of whole years.
| Age (years) | |||||||
| Students (\%) |
Represent the data in a percentage cumulative frequency polygon.
The oldest of these students qualify as 'mature'. Use your polygon to estimate the minimum age requirement for a student to be considered mature. Give your answer to the nearest month.


