
The diagram below shows an iron rod with two coils of wire around it. Coil X is connected to a battery and a switch; coil Y is connected to an ammeter. When the switch is closed, coil X acts like an electromagnet. Coil Y experiences a change in the magnetic field and has a current induced in it which causes the ammeter to jump to the right. The ammeter then returns to zero
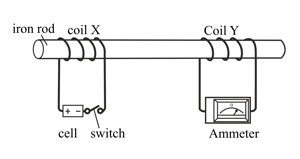
Describe the reading on the ammeter when the switch is opened again.
Important Questions on Consequences
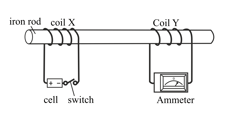
The diagram below shows an iron rod with two coils of wire around it. Coil X is connected to a battery and a switch; coil Y is connected to an ammeter. When the switch is closed, coil X acts like an electromagnet. Coil Y experiences a change in the magnetic field and has a current induced in it which causes the ammeter to jump to the right. The ammeter then returns to zero

The iron rod is replaced with a wooden one. Explain what the difference in the induced current would be.
The diagram below shows an iron rod with two coils of wire around it. Coil X is connected to a battery and a switch; coil Y is connected to an ammeter. When the switch is closed, coil X acts like an electromagnet. Coil Y experiences a change in the magnetic field and has a current induced in it which causes the ammeter to jump to the right. The ammeter then returns to zero
The number of turns in the wire in coil X is doubled. Explain why the ammeter reading is greater when the switch is closed.
The diagram below shows an iron rod with two coils of wire around it. Coil X is connected to a battery and a switch; coil Y is connected to an ammeter. When the switch is closed, coil X acts like an electromagnet. Coil Y experiences a change in the magnetic field and has a current induced in it which causes the ammeter to jump to the right. The ammeter then returns to zero
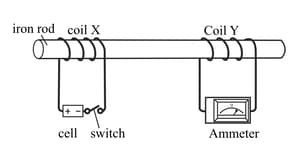
The number of turns in the wire in coil X is doubled. Give one other way in which the ammeter reading could be increased.
The two graphs show the voltage output from a mains power supply (left) and from a battery (right).
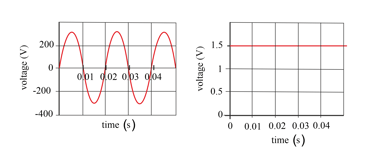
What is the peak voltage from the mains supply?
The two graphs show the voltage output from a mains power supply (left) and from a battery (right).
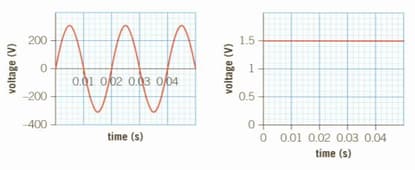
Use the graph to calculate the frequency of the mains voltage
The two graphs show the voltage output from a mains power supply (left) and from a battery (right).

Explain which of these electricity supplies is the more dangerous.


