
EASY
KCET (UG)
IMPORTANT
Earn 100
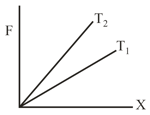
The diagram below shows the change in the length of a thin uniform wire caused by the application of stress at two different temperatures and . The variation shown suggests that
57.14% studentsanswered this correctly
Important Questions on Elasticity
EASY
KCET (UG)
IMPORTANT
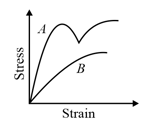
The diagram shows stress vs. strain curve for the material and . From the curves we infer that
EASY
KCET (UG)
IMPORTANT
EASY
KCET (UG)
IMPORTANT
EASY
KCET (UG)
IMPORTANT
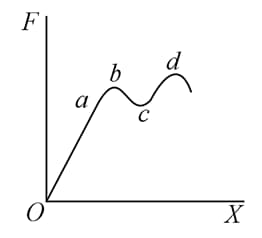
The diagram shown below represents the applied forces per unit area with the corresponding change (per unit length) produced in a thin wire of uniform cross-section in the curve shown. The region in which the wire behaves like a liquid is
EASY
KCET (UG)
IMPORTANT
EASY
KCET (UG)
IMPORTANT
EASY
KCET (UG)
IMPORTANT
EASY
KCET (UG)
IMPORTANT


