
EASY
Lower Secondary Stage 8
IMPORTANT
Earn 100
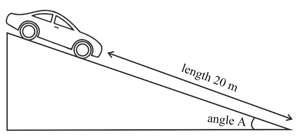
The diagram shows an experiment that Oliver has set up to measure time it takes for a toy car to roll down a slope at different angles. Describe the best device that Oliver could use for measuring the time. Include a short description of how the device works.
Important Questions on Measuring Motion
EASY
Lower Secondary Stage 8
IMPORTANT
EASY
Lower Secondary Stage 8
IMPORTANT
EASY
Lower Secondary Stage 8
IMPORTANT
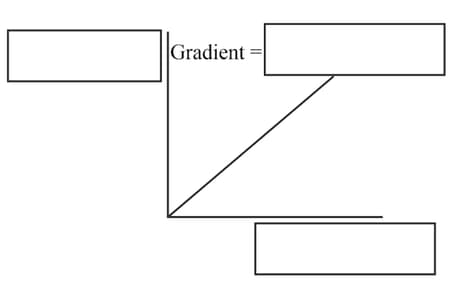
The diagram shows the distance-time graph. Complete the labels using the words.
EASY
Lower Secondary Stage 8
IMPORTANT
EASY
Lower Secondary Stage 8
IMPORTANT
EASY
Lower Secondary Stage 8
IMPORTANT
EASY
Lower Secondary Stage 8
IMPORTANT
Find the graph showing the motion of a car travelling at steady speed.
EASY
Lower Secondary Stage 8
IMPORTANT
Find the graph showing the motion of a person who walks a short distance and then stand still.


