
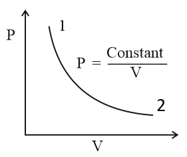
The figure below shows the plot of versus p for oxygen gas at two different temperatures.
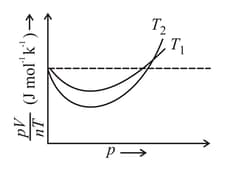
Read the following statements concerning the above curves.
1. The dotted line corresponds to the ideal gas behaviour.
2.
3. The value of at the point where the curves meet on the -axis is the same for all gases.
1. The dotted line corresponds to the ideal gas behaviour.
2.
3. The value of at the point where the curves meet on the -axis is the same for all gases.
Important Questions on Thermal Properties of Matter
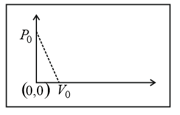
An ideal gas undergoes a circular cycle centred at , as shown in the diagram.
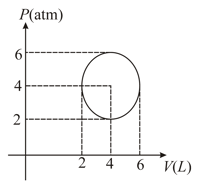
The maximum temperature attained in this process is close to
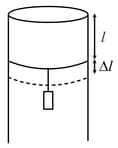
A long cylindrical pipe of radius is closed at its upper end and has an airtight piston of negligible mass as shown. When mass is attached to the other end of piston, it moves down by a distance, before coming to equilibrium. Assuming air to be an ideal gas, (see figure) is close to , one atmospheric pressure is ),
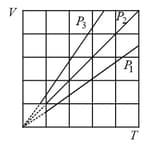
Out of the following which one correctly represents the diagram?
(Atmospheric pressure = of Hg)
( is universal gas constant and is the acceleration due to gravity)


