The figure shows a circuit having eight resistances of each, labelled to , and two ideal batteries with voltages and .
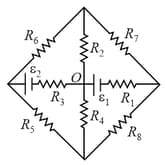
Which of the following statement(s) is(are) correct?
Important Questions on Current Electricity
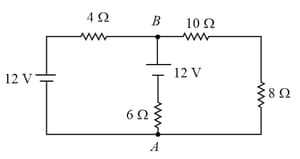
In the circuit, given in the figure currents in different branches and value of one resistor are shown. Then potential at point with respect to the point is:
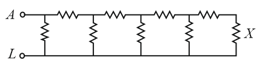
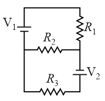
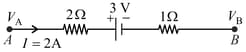
If a current of magnitude, flows through the resistor marked , what is the potential difference measured between points and ?
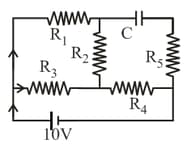
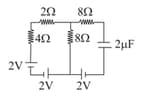
An ideal cell of emf is connected in circuit shown in figure. Each resistance is . The potential difference (in ) across the capacitor when it is fully charged is _____________
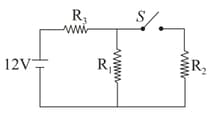
What will be current through the resistor in the given circuit, a long time after the switch is switched on?
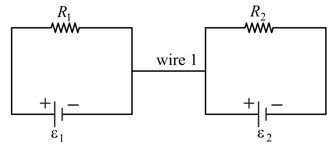
In the circuit, wire is of negligible resistance. Then
The figure below shows a circuit and its input voltage as a function of time .
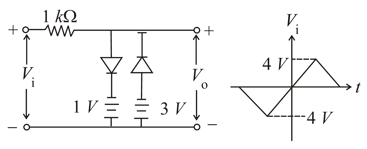
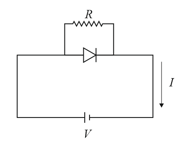
Assuming the diodes to be ideal, which of the following graphs depicts the output voltage as function of time
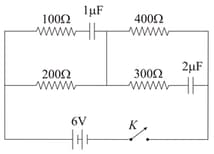
The resistance in following circuit are The emf of the battery is volts. When switch is closed, the potential across resistance is changed by an amount.
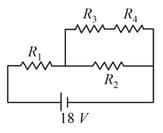
The potential difference between the points and in the given figure is
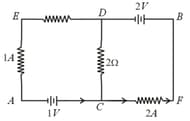
The current passing through the branch of the circuit shown in the figure is:
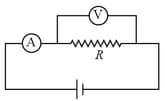
What is the current shown in the given circuit?
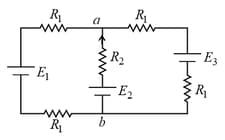
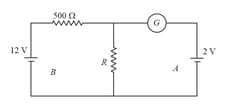
In the circuit, the galvanometer shows zero deflection. If the batteries and have negligible internal resistance, then the value of is
Consider the circuit shown.
If all the cells have negligible internal resistance, what will be the current through the resistor when steady state is reached?
For a diode connected in parallel with a resistor, which is the most likely current -voltage characteristic graph?
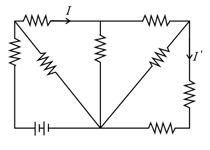
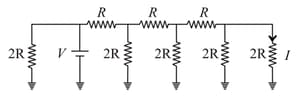
All the resistors are identical. The ratio is