
EASY
JEE Main
IMPORTANT
Earn 100
The figure shows the pressure versus density graph for an ideal gas at two temperatures and .
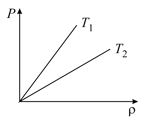
The relation between and is,
50% studentsanswered this correctly
Important Questions on Thermometry, Thermal Expansion and Kinetic Theory of Gases
EASY
JEE Main
IMPORTANT
From the graph, what conclusion can be drawn?
MEDIUM
JEE Main
IMPORTANT
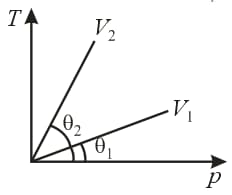
versus graph of equal masses of and is shown in the figure. Choose the correct alternative
EASY
JEE Main
IMPORTANT
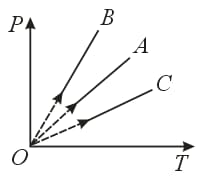
Pressure versus temperature graph of an ideal gas constant volume is shown by the straight line . Now, mass of the gas is doubled and volume is halved, then the corresponding pressure versus temperature graph will be shown by the line
EASY
JEE Main
IMPORTANT
Which one of the following graphs represent the behaviour of an ideal gas at constant temperature?
EASY
JEE Main
IMPORTANT
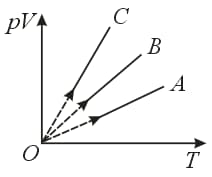
The curve between absolute temperature and is,
HARD
JEE Main
IMPORTANT
Volume–temperature graph at constant pressure for a mono atomic gas in in is,
EASY
JEE Main
IMPORTANT
By what factor, the velocity will change, if the temperature is raised from to
EASY
JEE Main
IMPORTANT
Two different gases of molecular masses and are at the same temperature. What is the ratio of their mean square speeds?


