The following data relates to the cost of construction ofa house in Mumbai. Represent the data in a pie chart.
Items
Cement
Steel
Bricks
Timber
Labour
Miscellaneous
Expenditure
Important Questions on Histogram, Pie Chart and Line Graph
In the month of October 2009, a house holder spent his monthly salary amounting to t 7,200 on different items as given below. Represent the information in the form of a pie chart.
| Items | Clothing | Food | House rent | Education | Miscellaneous |
| Amount spent (in ₹) |
The pie chart given in the figure shows how Arushi spends her pocket money. Read the pie chart and answer the following questions:
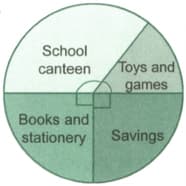
How does Arushi spend the largest amount of her pocket money?
The pie chart given in the figure shows how Arushi spends her pocket money. Read the pie chart and answer the following questions:

What fraction of her pocket money does she save?
The pie chart given in the figure shows how Arushi spends her pocket money. Read the pie chart and answer the following questions:

What percentage of her money is spent on books and stationery?
The pie chart given in the figure shows how Arushi spends her pocket money. Read the pie chart and answer the following questions:
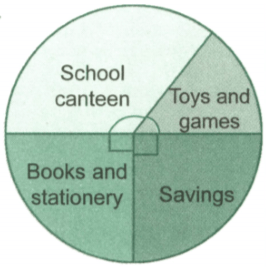
If her total pocket money was , find the ratio of her expenditure to the savings.
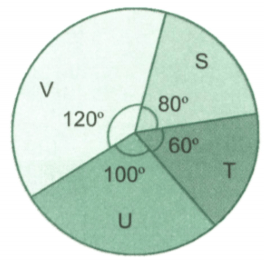
Observe the pie chart given in the figure. It shows the market share of four companies S, T, U and V. Now answer the following questions:

If the market share of company S is crores, what is the market share of company T?
Observe the pie chart given in the figure. It shows the market share of four companies S, T, U and V. Now answer the following questions:

Which company has the maximum market share?
Observe the pie chart given in the figure. It shows the market share of four companies S, T, U and V. Now answer the following questions: