
The following data represents the number of students using a different mode of transportation to come to school.
Mode of transport
Bicycle
School bus
Car
Walking
Number of students
Draw a pie chart to represent this data.
Important Questions on Data Handling
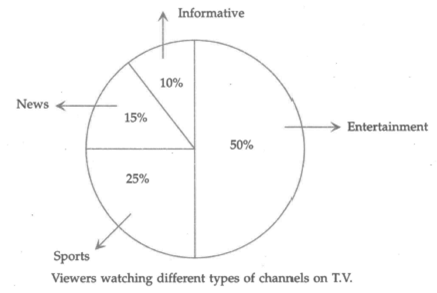
Answer the following questions based on the pie chart given below:
Which type of programmes are viewed the most

Answer the following questions based on the pie chart given below:
Which type of programmes are viewed the least

Answer the following questions based on the pie chart given below:
Which two types of programmes have number of viewers equal to those watching sports channels
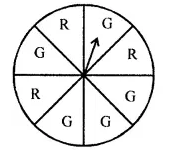
Suppose you spin the wheel shown in adjoining figure.
List the outcomes of getting a green sector and not getting a green sector on this wheel.
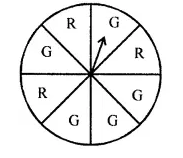
Suppose you spin the wheel shown in adjoining figure.
Find the probability of getting a green sector.
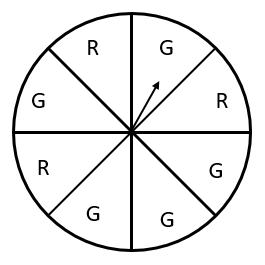
Suppose you spin the wheel shown in adjoining figure.
Find the probability of not getting a green sector.
A bag has red and yellow balls. A ball is drawn from the bag without looking into the bag. What is the probability of getting a red ball
A bag has red and yellow balls. A ball is drawn from the bag without looking into the bag. What is the probability of getting not a red ball


