
The following histogram illustrates the masses, kilograms, of the sales of hay that a farmer made to customers last year.
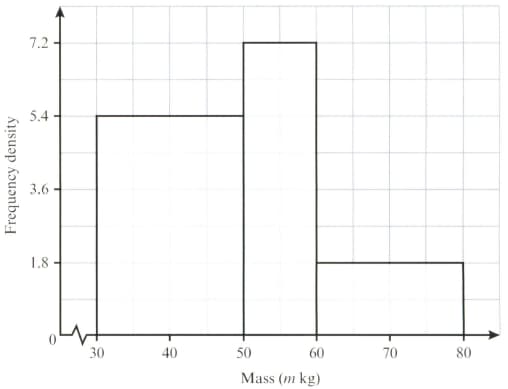
Show that a calculated estimate of the mean is equal to the median.
Important Questions on Measures of Central Tendency
The following histogram illustrates the masses, kilograms, of the sales of hay that a farmer made to customers last year.
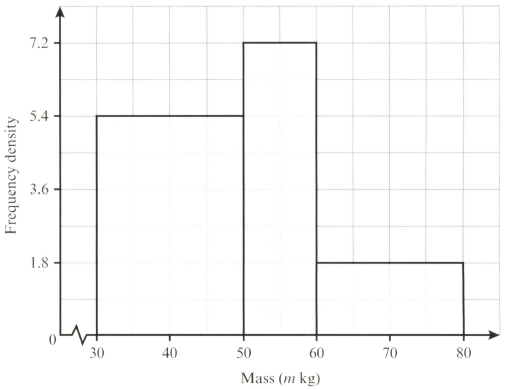
Estimate the price per kilogram at which the hay was sold, given that these sales generated exactly Why is it possible that none of the customers actually paid this amount per kilogram for the hay?
An Internet service provider wants to know how customers rate its services. A questionnaire asks customers to tick one of the following boxes excellent, good, average, poor, very poor
How might the company benefit from knowing each of the available average responses of its customers?
An internet service provider wants to know how customers rate its services. A questionnaire asks customers to tick one of the following boxes.
excellent, good, average, poor, very poor
What additional benefit could the company obtain by using the following set of tick boxes instead?
excellent good average poor very poor
The numbers of items returned to the electrical department of a store on each of consecutive days are given in the following table.
| No. items | |||||||
| No. days |
Write down the median.
The numbers of items returned to the electrical department of a store on each of consecutive days are given in the following table.
| No. items | |||||||
| No. days |
Is the mode a good value to use as the average in this case? Give a reason for your answer.
The numbers of items returned to the electrical department of a store on each of consecutive days are given in the following table.
| No. items | |||||||
| No. days |
Find the value of given that a calculated estimate of the mean is
The numbers of items returned to the electrical department of a store on each of consecutive days are given in the following table.
| No. items | |||||||
| No. days |
Sketch a curve that shows the shape of this set of data, and mark onto it the relative positions of the mode, the mean and the median.
As part of a data collection exercise, members of a certain school year group were asked how long they spent on their Mathematics homework during one particular week. The times are given to the nearest hour. The results are displayed in the following table.
| Time spent ( hours) | |||||
| Frequency |
Draw, on graph paper, a histogram to illustrate this information and find the difference between frequencies of the classes and .


