
The following information relates to the age of death of persons in an area :
If the class intervals are Then the percentage frequencies for the last five class intervals are
Important Questions on Organisation of Data
Arrange the following households in ascending order of per capita income.
| Name of Household | Total Income of Household | Size of the Household |
| Rajat | 6000 | 5 |
| Raman | 5000 | 5 |
| Suman | 3200 | 4 |
| Priya | 8400 | 6 |
The given pie-diagram shows the marks scored by a student in different subjects e.g. English, Hindi, Mathematics, Science and Social Science in an examination. Assuming that the total marks for the examination is answer the following question:

The marks obtained in three subjects English, science and Social Science is what percentage of the total marks ?
The given pie-diagram shows the marks scored by a student in different subjects e.g. English, Hindi, Mathematics, Science and Social Science in an examination. Assuming that the total marks for the examination is answer the following question:

The subject in which the student scored marks is
The given pie-diagram shows the marks scored by a student in different subjects e.g. English, Hindi, Mathematics, Science and Social Science in an examination. Assuming that the total marks for the examination is answer the following question:

The subject in which the student scored marks ?
The daily wage of a person in rural area is Rs. 200 an the poverty line for a person is fixed at Rs. 800 per month for rural areas. Following table shows the detail of employment of four families living in a village. Identify the family living below poverty line:
| Family | Total days of Employment of got in a month by the family | Members of family |
| Ram | 10 | 2 |
| Radha | 18 | 3 |
| Raju | 12 | 4 |
| Pooja | 25 | 5 |
The given pie-diagram shows the marks scored by a student in different subjects e.g. English, Hindi, Mathematics, Science and Social Science in an examination. Assuming that the total marks for the examination is answer the following question:
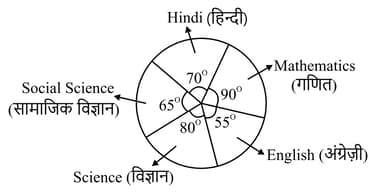
The marks scored in Hindi and Mathematics exceed the marks scored in English and Social Science by:
Study the pie chart and information given below and answer the following questions. There are students in the school who opted Gardening as a hobby.
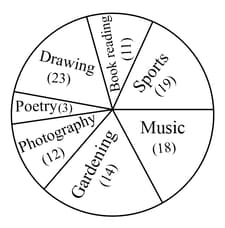
What is the total no. of students in the school ?
The given pie-diagram shows the marks scored by a student in different subjects e.g. English, Hindi, Mathematics, Science and Social Science in an examination. Assuming that the total marks for the examination is answer the following question:

The marks scored in Mathematics is what percentage of the total marks ?
The given table represents the exports (in ₹crores)of four items and over a period of six years. Study the table and answer the question that follows.
| Items | ||||
| Years | ||||
The total exports of item in and is what percentage of the total exports of all the four items in and ?


